RoboXpert Prime. Three strategies, one account, by request only.
Your capital
deserves proof.
Three of our own trading systems share one MetaTrader 5 account and cover the whole week. We tested them together, tick by tick, and show every step, every run and the worst phase.
Largest drawdown
23.0%all three together, over four yearsOne account, 12 months in, after slippage
€38,852+289%- 1Strategy 1Gold, yen, bitcoin · 1,698 trades−€937
- 2Strategy 2Gold, yen, bitcoin · 571 trades+€6,210
- 3Strategy 3Bitcoin · 3,171 trades+€23,579
- Start1 September 2022€10,000
Trading days
seven a weekBacktest in the MT5 Strategy Tester, all three strategies in one account, 1 September 2022 – 17 October 2026, $6 bitcoin spread, after slippage. Not a live account; past results do not predict future ones.
How we tested.
In six steps.
A backtest is only as good as the way it was made. Scroll through what we did.
Test record
- Platform
- MetaTrader 5 Strategy Tester
- Mode
- Every tick based on real ticks
- Period
- 1 September 2022 – 17 October 2026 (4.1 years)
- Account
- Euro account, leverage 1:500, IC Trading demo server
- Execution delay
- 50 ms on every order
- Start capital
- €2,500 · €5,000 · €10,000
- Bitcoin spread
- $6 · $15 · $20
- Settings
- Strategy 1 1.5% per market · Strategy 2 0.6% per trade · Strategy 3 Custom 8%
- Runs
- 9 joint runs + 3 control runs
- Tested
- 16 November 2026
Control runs: each strategy alone
Same test setup, one strategy switched on, compared with its own single test. Identical to the cent means the package runs the original rules.
- Strategy 1 $209,924.07 profit from $10,000 · 7,195 tradesidentical to its single test ·
2026-11-16-prime-v-db113-r100 - Strategy 2 $62,295.05 profit from $10,000 · 2,349 tradesidentical to its single test ·
2026-11-16-cmb-v-sb-r05 - Strategy 3 $2,734,333.33 profit from $10,000 · 13,523 tradesidentical to its single test ·
2026-11-16-cmb-v-btc-r09
The numbers.
Good months and bad ones.
€10,000 start, $6 bitcoin spread, after slippage. The worst phase is shown as clearly as the best.
- after the first 12 months
- +289%
- largest drawdown, open trades included
- 23.0%
- months ended higher
- 41/50
- trades on one balance
- 21,298
- worst month, June 2023
- −7.7%
- largest drop of the closed balance after slippage
- 22.3%
- from the low of that drop back to a new high
- 18 days
The worst phase
From 19 September 2022 to 23 October 2022 the closed balance fell 22.3% from its high; on 10 November 2022 it was back above it. That can happen again, and deeper.
Every month, after slippage
- September 2022: +25.2%
- October 2022: −2.0%
- November 2022: +42.2%
- December 2022: +0.7%
- January 2023: +30.2%
- February 2023: +18.2%
- March 2023: +45.3%
- April 2023: +0.6%
- May 2023: +11.7%
- June 2023: −7.7%
- July 2023: −3.2%
- August 2023: −1.5%
- September 2023: +13.7%
- October 2023: +20.4%
- November 2023: +35.7%
- December 2023: +39.8%
- January 2024: +5.3%
- February 2024: +33.7%
- March 2024: +78.8%
- April 2024: +54.7%
- May 2024: +39.6%
- June 2024: +8.0%
- July 2024: +29.8%
- August 2024: +14.4%
- September 2024: +12.9%
- October 2024: +14.0%
- November 2024: +25.5%
- December 2024: +20.2%
- January 2025: +7.0%
- February 2025: −0.8%
- March 2025: −1.0%
- April 2025: +18.5%
- May 2025: +30.1%
- June 2025: −4.3%
- July 2025: +14.4%
- August 2025: −1.3%
- September 2025: +17.5%
- October 2025: +6.1%
- November 2025: +12.1%
- December 2025: +2.3%
- January 2026: +7.1%
- February 2026: +14.6%
- March 2026: +10.6%
- April 2026: +5.3%
- May 2026: +6.3%
- June 2026: +4.6%
- July 2026: +8.9%
- August 2026: +8.9%
- September 2026: +14.3%
- October 2026: −2.4%
Run 2026-11-16-prime-eur10k-b6.
We tried to break it.
Here is the result.
The same main scenario under harder conditions. Bars show the largest drop of the closed balance after slippage; the dashed line is the normal run.
2026-11-16-prime-eur10k-b62026-11-16-prime-eur10k-b6-cost22026-11-16-prime-eur10k-b6-d5002026-11-16-prime-eur10k-b6-lot10Monte Carlo resamples the trades of the normal run; the other rows are separate tester runs of the same three files.
Four years.
One balance.
Scroll, and the account grows month by month, after slippage. Red marks the worst phase. Logarithmic scale.
- 2022+76%
- 2023+474%
- 2024+1,594%
- 2025+150%
- 2026+110%
Your capital.
Your spread.
Pick a start capital and your broker’s bitcoin spread. Each combination is its own test run with all three strategies on one account.
Tested until
€10,000, $6 bitcoin spread: largest drawdown 23.0%, +420% a year after slippage.
- After 12 months
- +289%€10,000 became €38,852, after slippage.
- Largest drawdown
- 23.0%All three strategies together, open trades included. Closed trades after slippage: 22.3%.
- A year, on average
- +420%After slippage, compounded over 4.1 years.
- Tester balance at the end
- €28.1mAbove about €236,209 bitcoin orders exceed the 10 lots many brokers accept. Read it as the strategy, not as an account.
- 2022 from Sep+76%
- 2023+474%
- 2024+1,594%
- 2025+150%
- 2026 to Oct+110%
Where the profit came from
- Strategy 156%
- Strategy 227%
- Strategy 317%
RoboXpert Prime, three strategies in one account, €10,000, bitcoin $6 fixed spread, tested , run 2026-11-16-prime-eur10k-b6
All nine test runs
| Start | Bitcoin spread | After 12 months | A year | Largest drawdown | Run |
|---|---|---|---|---|---|
| €2,500 | $6 | +289% | +533% | 25.6% | 2026-11-16-prime-eur2k5-b6 |
| €2,500 | $15 | +75% | +425% | 25.0% | 2026-11-16-prime-eur2k5-b15 |
| €2,500 | $20 | −3% | +330% | 33.6% | 2026-11-16-prime-eur2k5-b20 |
| €5,000 | $6 | +276% | +472% | 23.0% | 2026-11-16-prime-eur5k-b6 |
| €5,000 | $15 | +80% | +394% | 26.3% | 2026-11-16-prime-eur5k-b15 |
| €5,000 | $20 | +4% | +319% | 34.0% | 2026-11-16-prime-eur5k-b20 |
| €10,000 | $6 | +289% | +420% | 23.0% | 2026-11-16-prime-eur10k-b6 |
| €10,000 | $15 | +83% | +352% | 26.0% | 2026-11-16-prime-eur10k-b15 |
| €10,000 | $20 | −6% | +285% | 34.2% | 2026-11-16-prime-eur10k-b20 |
How these tests were run
All three strategies ran together in one MetaTrader 5 tester account: one balance, one margin, positions open at the same time. MetaTrader tests one EA per run, so we put the three unchanged release files into one test EA and checked first that each part alone gives its own single result to the cent.
Settings: strategy 1 1.5% per market, strategy 2 0.6% per trade, strategy 3 Custom 8%. Real ticks from 1 September 2022 to 17 October 2026, euro account, leverage 1:500, IC Trading demo server. Gold and yen at each strategy’s own tested costs, bitcoin on Binance ticks with the fixed spread you pick.
The tester fills without slippage. We subtracted it afterwards from the same trades: strategies 1 and 2 gold $0.30 per ounce, yen 0.5 pip and bitcoin $6 per entry and exit (target exits without), strategy 3 without, as on its own product page. Backtests, not live accounts; past drawdown is not a loss limit.
Straight from
the MT5 report.
The charts MetaTrader 5 saved with the report of the run above, unedited. They show the tester’s own fills, before slippage.
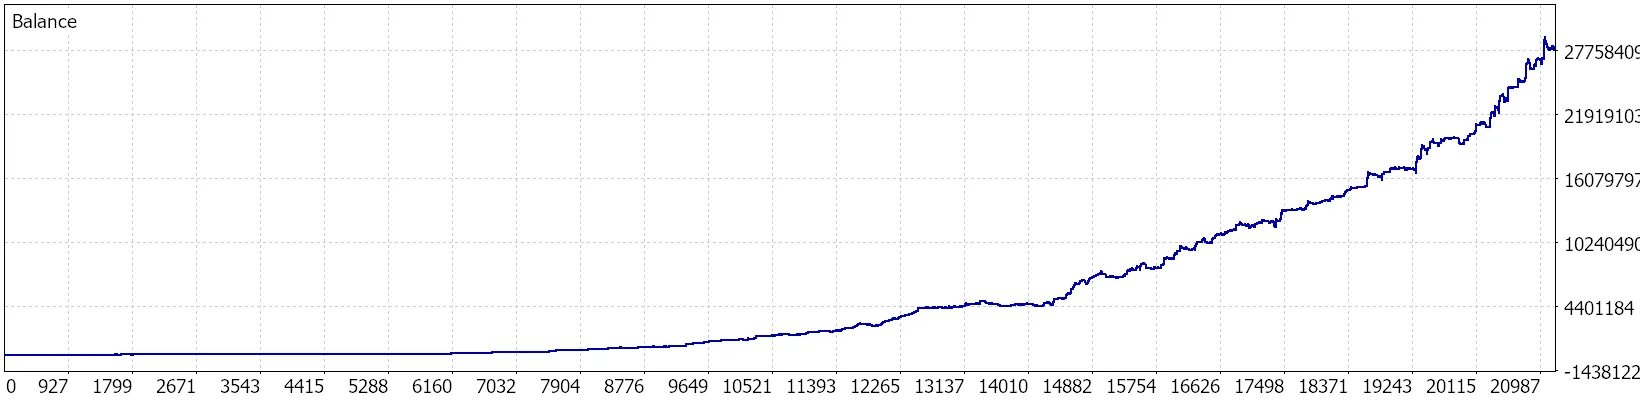
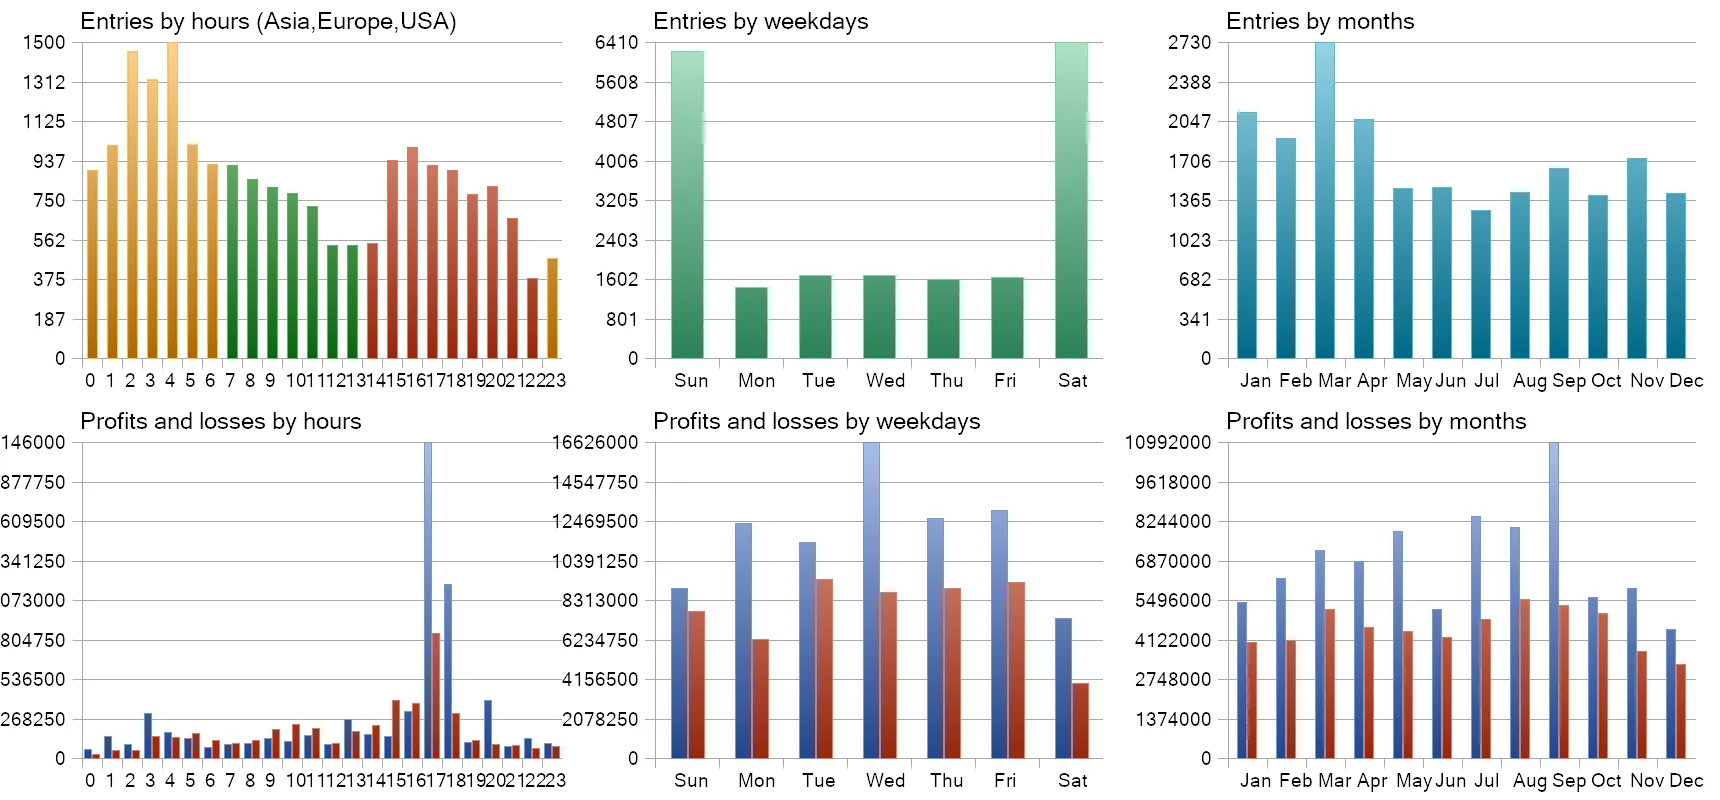
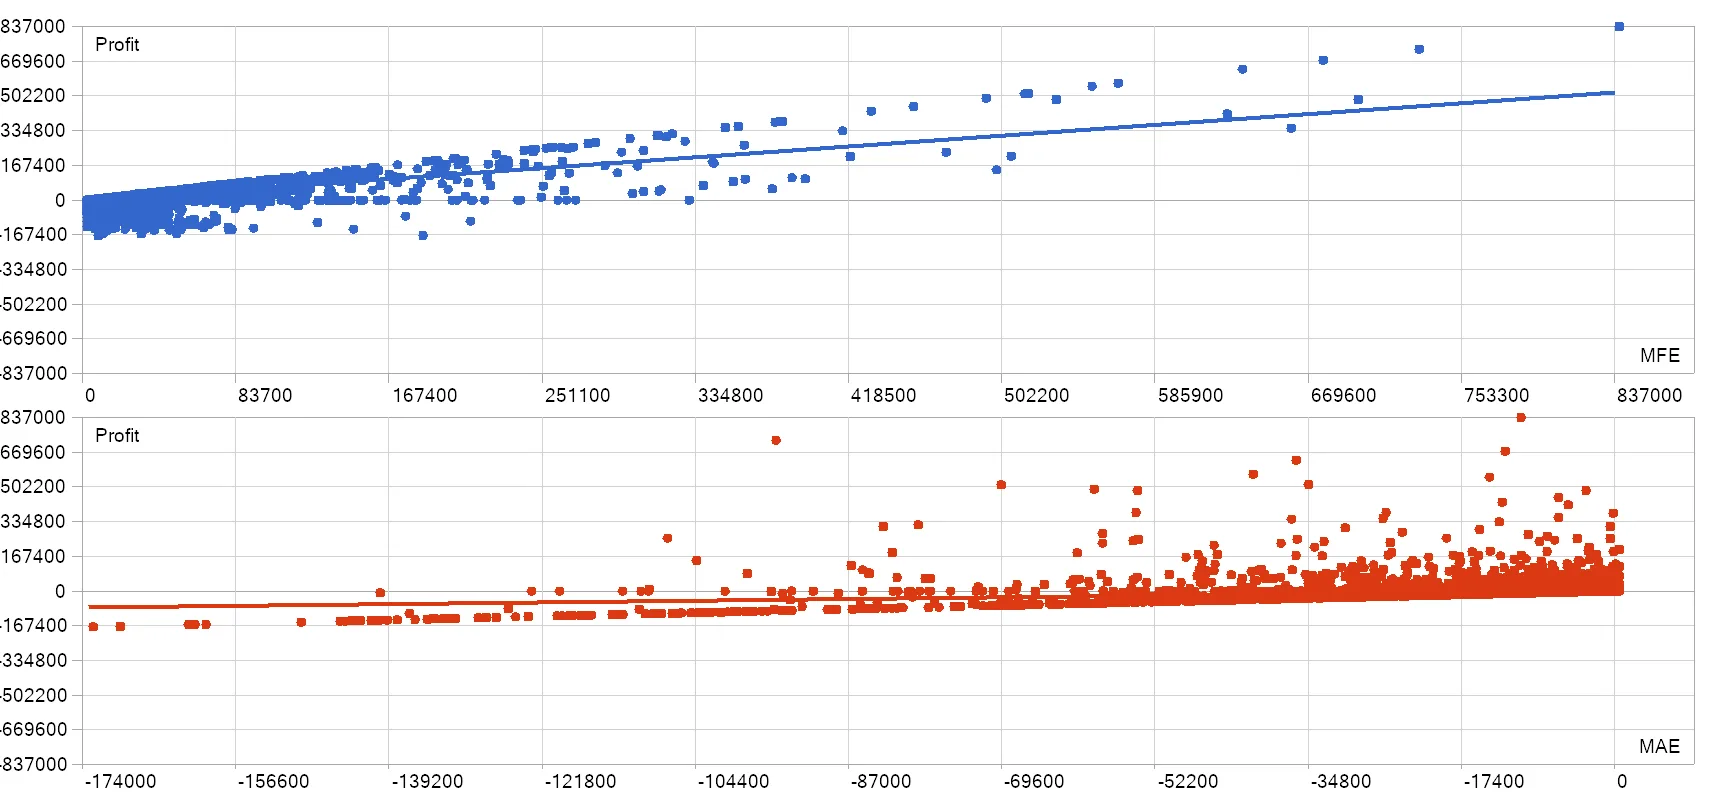
Main scenario: €10,000 start, bitcoin $6 fixed spread, 1 September 2022 – 17 October 2026, release versions of all three as of 16 November 2026, tested 16 November 2026, run 2026-11-16-prime-eur10k-b6. The x-axis of the balance graph counts deals, not dates.
Three strategies.
No day off.
Each strategy trades its own markets on its own days and manages only its own trades. Which ones they are, we explain when you ask for access.
- Strategy 1Gold, yen, bitcoin, every day
- Strategy 2Gold, yen, bitcoin, Monday to Friday
- Strategy 3Bitcoin, Saturday and Sunday
Its own magic number
Every strategy marks its orders and only manages and closes its own positions.
A stop on every trade
Sent to the broker with the position, so it holds when your terminal is offline.
No grid, no martingale
No strategy in Prime adds to a losing position or raises its size after a loss.
Honest numbers
come with limits.
Read these before you ask for access.
Compounding has a ceiling
Positions grow with the balance. From about €236,209 the test sends bitcoin orders above 10 lots, which many brokers do not accept, and large orders fill worse. The end balances show the strategy, not a reachable account.
The bitcoin spread matters
At $20 the same €10,000 made +285% a year instead of +420%, largest drawdown 34.2%. Ask your broker first.
Losses can come together
The three strategies rarely move in step, but they can lose in the same week. The drawdown shown is the joint one.
A backtest, not a promise
No live record on this page. Small accounts start slower: with €2,500 the smallest lot sizes set the pace at first.
One terminal.
Three charts.
- A hedging MT5 account
- Through our partner link, with gold, USDJPY and bitcoin and tight spreads. Netting accounts merge positions and do not work.
- From €2,500, better €10,000
- Small accounts trade the smallest lot sizes for a while; the configurator shows each start capital.
- A Windows VPS
- Each strategy on its own chart, Algo Trading on, connected seven days a week. Hosting is a separate cost.
Not in the shop.
By request only.
Prime needs the right account, enough capital and a careful setup. We check that with every request before anyone starts.
Message us
Tell us your start capital and broker on Telegram.
Open the account
A hedging MT5 account through our partner link.
Set up together
You get the files with the Prime settings; we go through the three charts with you.
Direct message to @RoboXpertAI
Questions before you ask
How do I get RoboXpert Prime?
Only on request. Message us on Telegram with your start capital and broker. If Prime fits your account, we set it up with you and send you the files and settings.
Which strategies are inside?
Three of our own Expert Advisors, each with its own markets, trading days and stops, each tested on its own before. Which ones they are and how they trade, we explain when you request access.
Can one strategy close the trades of another?
No. Each one marks its orders with its own magic number and only manages and closes positions with that number.
How do I know the test is real?
Every figure on this page comes from a dated MetaTrader 5 test run with its run number. Before the joint test we ran each strategy alone inside the same test setup and compared it with its own single test: all three matched to the cent. The original MT5 report charts are on this page.
What does it cost?
No licence fee: access runs through our partner-broker arrangement, and we receive broker rebates on referred trading activity. Spreads, commissions, swaps and VPS hosting can still cost money.
How much money do I need?
We tested from €2,500. Small accounts trade the smallest lot sizes at first and grow more slowly; in our test €2,500 at a $6 bitcoin spread had a largest drawdown of 25.6%.
Why are the end balances so large?
Every strategy risks a share of the current balance, so positions grow with the account. From about €236,209 bitcoin orders in the test exceed the 10 lots many brokers accept per order, and large orders fill worse. Read the first years and the drawdown, not the end balance.
Is there a live account?
Not on this page. The figures are backtests with real ticks and fixed spreads. A backtest is not a forecast.