Learn
Grid Trading vs Martingale: How Forex EAs Increase Risk
At a glance
Grid trading arranges entries across price levels. Martingale increases trade size following losses; recovery EAs can combine a grid with similar sizing while earlier trades remain open. A fixed-lot grid also accumulates exposure. Neither entry spacing nor increasing lots creates a profitable edge by itself. Unlimited loss recovery is incompatible with finite capital, but the label alone does not prove that every bounded grid must lose its entire account. Examine position sizing, exits, margin and evidence after costs.
On this page
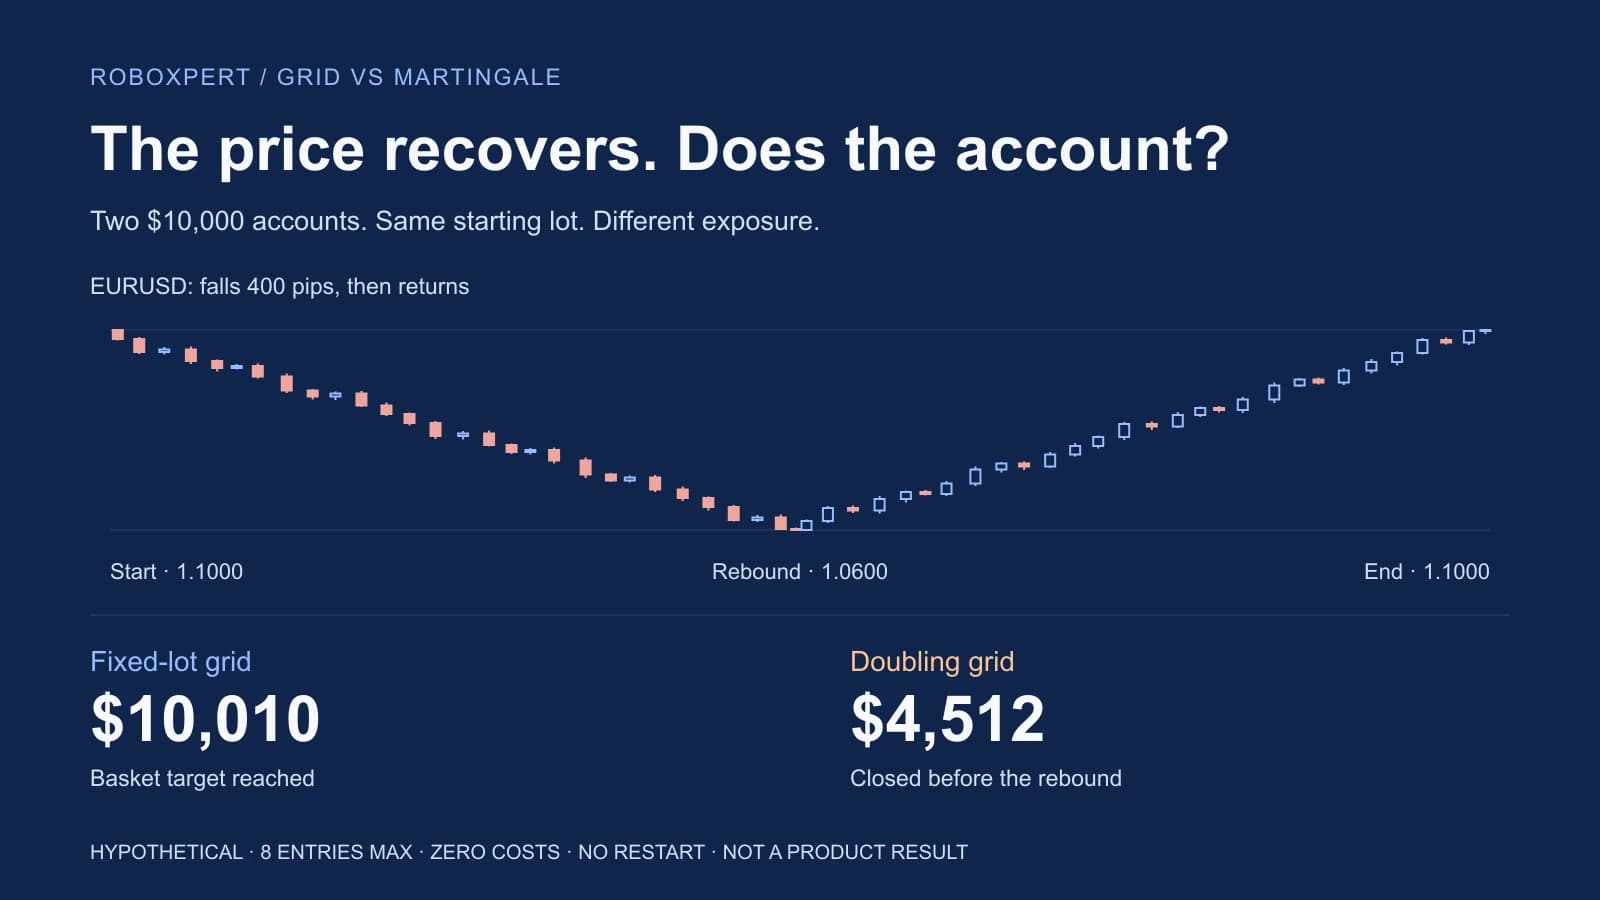
A forex robot opens a small trade. The market moves against it, so the robot opens another. Then another. Is that grid trading, martingale—or both?
The distinction matters because a small starting lot does not describe the exposure the EA can eventually build. This guide separates the mechanics and lets you follow two simple systems through the same invented prices, including a recovery that comes too late.
Disclosure: RoboXpert develops trading software, including the SkyWebR grid EA. The examples below are original teaching models, not SkyWebR results or an independent review of our products. Platform references were checked on 21 September 2026. AI assisted with research, drafting and implementation; see our methodology and commercial disclosure.
Grid vs martingale: what is the difference?
Grid trading describes the placement of entries across price levels. Martingale describes a loss-dependent position-sizing progression. A grid does not have to increase lot sizes, and a martingale does not need simultaneous grid positions.
In the classic doubling version of martingale, the next stake increases after a realized loss. Many Forex recovery EAs use martingale-style sizing inside a basket: they add larger positions while previous trades are still in floating loss. Our example models that combination, not a sequence of individually closed losing trades.
Scroll horizontally if needed
| Feature | Fixed-lot averaging grid | Classic martingale | Grid with doubling lots |
|---|---|---|---|
| Entry trigger | Successive adverse price levels | A new trade following a loss | Successive adverse price levels |
| Size progression | Same size for each entry | Traditionally double after a loss | Double with each additional entry |
| Earlier trades | Stay open in this example | Earlier losing trade has closed | Stay open in this example |
| Exposure | Rises as more trades remain open | Next trade becomes larger | Number of entries and trade size both increase |
| Main question | How many entries, how much total exposure, and what exit? | What loss sequence exceeds the sizing budget? | What happens before the recovery arrives? |
Grid implementations vary: some buy falling prices, some add in a favourable direction, and some place orders on both sides. This article focuses on a leveraged, one-direction averaging grid. Its behaviour is not a description of every grid or an unleveraged spot-crypto bot. For implementation examples, see Evgeniy Ilin's MQL5 article; it is an individual author's analysis, not a universal profitability verdict from MetaQuotes.
Do grid trading bots always fail?
No strategy label alone proves that every grid bot must eventually lose its entire account. But a promise of unlimited recovery through more or larger positions cannot be sustained with finite capital and finite trading limits. A sufficiently adverse path can exhaust the resources of an uncapped recovery system before a useful reversal occurs.
Separate three different claims:
Scroll horizontally if needed
| Claim | What the evidence supports |
|---|---|
| “It can always add another trade until it recovers.” | It cannot do this indefinitely. Capital, margin, volume limits and order availability impose boundaries. |
| “This configuration fails on this price path.” | A reproducible stress test can demonstrate that failure under its assumptions. It does not establish how often that path will occur. |
| “Every grid, including one with bounded exposure and loss exits, must go to zero.” | That conclusion needs more than the word grid. A capped system can take losses and continue; whether it has positive expectancy after costs remains a separate question. |
“Eventually” also needs a probability model and a horizon. In an illustrative independent-cycle model, if each cycle has the same failure probability p > 0, the probability of at least one failure in N cycles is 1 − (1 − p)ᴺ. It approaches 100% as N grows without bound. That conditional mathematical result does not supply p for a real EA or a date when it will fail. Real cycles need not be independent or have a constant probability, and a losing cycle is not automatically an account wipeout.
Likewise, a profitable backtest or several successful recovery cycles do not establish that the next cycle is survivable. A sizing rule changes the distribution of gains, losses and capital requirements; it does not by itself establish a trading edge.
Watch the same price path change two accounts
The chart opens with eight buy entries visible. Dashed lines show their entry prices; the labels show lot size and current floating profit or loss in USD. Switch between Fixed-lot account and Doubling account to compare exposure. The orders and the separate account panel always show the same selected account. Use Play from start or the slider to watch positions appear. Playback pauses when that account closes its basket and shows the reason and realized profit or loss. Its floating P&L then becomes zero and its equity stays equal to its balance. Continue price after exit shows the market moving on without changing the closed account. Select Final outcome to see what remains after the rebound; the expandable details compare both accounts. Open Adjust entries & loss limit, enable the loss-limit rule and try Gap through the limit. Reducing maximum entries from eight to five stops exposure growing sooner, but the open positions can still lose money.
Interactive stress example · hypothetical EURUSD
The price recovers.
Does the account?
Two separate $10,000 accounts. The same prices. Different position sizes.
Dashed lines = open buy entries · Labels = lots and floating USDSwipe horizontally to see the full chart.
Doubling account
Same account as the orders aboveEquity = balance + floating P&L
- Balance
- $10,000.00
- Floating P&L
- -$617.50
- Equity
- $9,382.50
8 open positions · 8 entries filled
Doubling account: the 8 open positions above produce -$617.50 floating P&L. Added to the $10,000.00 balance, that gives $9,382.50 equity.
Selected account details and key observations
| Entry quote | Entry price | Lots | Floating USD |
|---|---|---|---|
| 0 | 1.1000 | 0.01 | -$17.50 |
| 39 | 1.0975 | 0.02 | -$30.00 |
| 124 | 1.0950 | 0.04 | -$50.00 |
| 167 | 1.0925 | 0.08 | -$80.00 |
| 266 | 1.0900 | 0.16 | -$120.00 |
| 291 | 1.0875 | 0.32 | -$160.00 |
| 400 | 1.0850 | 0.64 | -$160.00 |
| 457 | 1.0825 | 1.28 | +$0.00 |
| At this quote | Fixed lots | Doubling lots |
|---|---|---|
| Open volume | 0.08 lots | 2.55 lots |
| Worst equity decline | 0.70% | 6.17% |
| Balance | $10,000.00 | $10,000.00 |
| Floating P&L | -$70.00 | -$617.50 |
| Average open entry | 1.09125 | 1.08492 |
| Used margin | $288.67 | $9,201.25 |
| Margin level | 3440.0% | 102.0% |
| Quote | EURUSD | Fixed equity | Doubling equity | Event |
|---|---|---|---|---|
| 0 | 1.1000 | $10,000.00 | $10,000.00 | — |
| 39 | 1.0975 | $9,997.50 | $9,997.50 | — |
| 100 | 1.0960 | $9,994.50 | $9,993.00 | — |
| 124 | 1.0950 | $9,992.50 | $9,990.00 | — |
| 167 | 1.0925 | $9,985.00 | $9,972.50 | — |
| 200 | 1.0922 | $9,983.80 | $9,968.00 | — |
| 266 | 1.0900 | $9,975.00 | $9,935.00 | — |
| 291 | 1.0875 | $9,962.50 | $9,857.50 | — |
| 300 | 1.0882 | $9,966.70 | $9,901.60 | — |
| 400 | 1.0850 | $9,947.50 | $9,700.00 | — |
| 457 | 1.0825 | $9,930.00 | $9,382.50 | — |
| 500 | 1.0800 | $9,910.00 | $8,745.00 | — |
| 600 | 1.0768 | $9,884.40 | $7,929.00 | — |
| 700 | 1.0734 | $9,857.20 | $7,062.00 | — |
| 800 | 1.0702 | $9,831.60 | $6,246.00 | — |
| 900 | 1.0662 | $9,799.60 | $5,226.00 | — |
| 960 | 1.0634 | $9,777.20 | $4,512.00 | Doubling: Closed: model margin boundary |
| 1000 | 1.0620 | $9,766.00 | $4,512.00 | — |
| 1050 | 1.0600 | $9,750.00 | $4,512.00 | Lowest price |
| 1100 | 1.0626 | $9,770.80 | $4,512.00 | — |
| 1200 | 1.0666 | $9,802.80 | $4,512.00 | — |
| 1300 | 1.0696 | $9,826.80 | $4,512.00 | — |
| 1400 | 1.0720 | $9,846.00 | $4,512.00 | — |
| 1500 | 1.0772 | $9,887.60 | $4,512.00 | — |
| 1600 | 1.0804 | $9,913.20 | $4,512.00 | — |
| 1700 | 1.0836 | $9,938.80 | $4,512.00 | — |
| 1800 | 1.0882 | $9,975.60 | $4,512.00 | — |
| 1900 | 1.0908 | $9,996.40 | $4,512.00 | — |
| 1939 | 1.0925 | $10,010.00 | $4,512.00 | Fixed: Closed: basket target |
| 2000 | 1.0954 | $10,010.00 | $4,512.00 | — |
| 2100 | 1.0992 | $10,010.00 | $4,512.00 | — |
| 2124 | 1.1000 | $10,010.00 | $4,512.00 | — |
Synthetic candles, not market data or a backtest. Bodies, wicks, orders and account values use the same quote path. Zero trading costs. Model assumptions.
This is an intentionally controlled comparison with the same starting lot, not the same maximum risk. The fixed-lot system carries far less volume. Its survival on these selected paths is therefore not proof that fixed-lot grids are safe or more profitable. Increasing its starting size, changing the market or repeating losing cycles can produce a very different outcome.
How fast do the lots grow?
For five entries, with every position still open:
Scroll horizontally if needed
| Entry | Fixed-lot grid | Doubling grid |
|---|---|---|
| 1 | 0.01 lot | 0.01 lot |
| 2 | 0.01 lot | 0.02 lot |
| 3 | 0.01 lot | 0.04 lot |
| 4 | 0.01 lot | 0.08 lot |
| 5 | 0.01 lot | 0.16 lot |
| Total open | 0.05 lot | 0.31 lot |
The second basket holds 6.2 times the open volume, not automatically 6.2 times the loss accumulated so far. Entry prices matter. In our identical 25-pip entry sequence, at the fifth entry the floating losses are $25 and $65, respectively. For the next adverse pip, before another entry or exit, the baskets lose $0.50 and $3.10 under the model's EURUSD contract assumptions.
After eight entries, volume is 0.08 versus 2.55 lots. The next adverse pip changes the baskets by $0.80 versus $25.50. Larger volume makes a smaller rebound sufficient to reach the weighted average entry, but makes further adverse movement more expensive.
For starting lot L and n simultaneously open entries:
- Fixed sizes: total lots = L × n.
- Doubling sizes: total lots = L × (2ⁿ − 1).
- Constant multiplier m ≠ 1: total lots = L × (mⁿ − 1) / (m − 1).
A multiplier below two slows the progression; any constant multiplier above one still gives geometric growth before caps and lot rounding. A seller calling it “soft recovery” does not change that arithmetic.
Even with fixed lots, the open loss at each newly reached, equally spaced adverse grid level grows faster than linearly while entries keep accumulating. For pip value v of the starting lot and spacing d, loss at entry n = v × d × n(n − 1) / 2, before costs. Once the entry cap is reached, the loss changes linearly with each further pip at the now-fixed total volume.
Why a rebound can arrive too late
The eight-entry doubling basket in the long-trend example reaches the simplified margin boundary at EURUSD 1.0634, a 366-pip decline from the first entry. Its account equity is $4,512, and the model closes the entire basket. The later return to 1.1000 leaves the account at $4,512 because those positions no longer exist.
That is a severe loss of 54.88%, not a claim that the balance reached zero. Margin close-out can happen while substantial equity remains. On the same path, the much smaller fixed-lot basket's maximum equity decline is 2.50%. It later reaches its small basket target. Those are outcomes of the specified model, not expected investment returns.
MetaTrader exposes balance, equity, used/free margin, margin level and account-specific stop-out settings. Stop-out thresholds can be expressed as a percentage or a money amount; the account configuration matters. Our 50% margin-level rule is one chosen assumption, not a universal MT4/MT5 rule. MQL5 account properties.
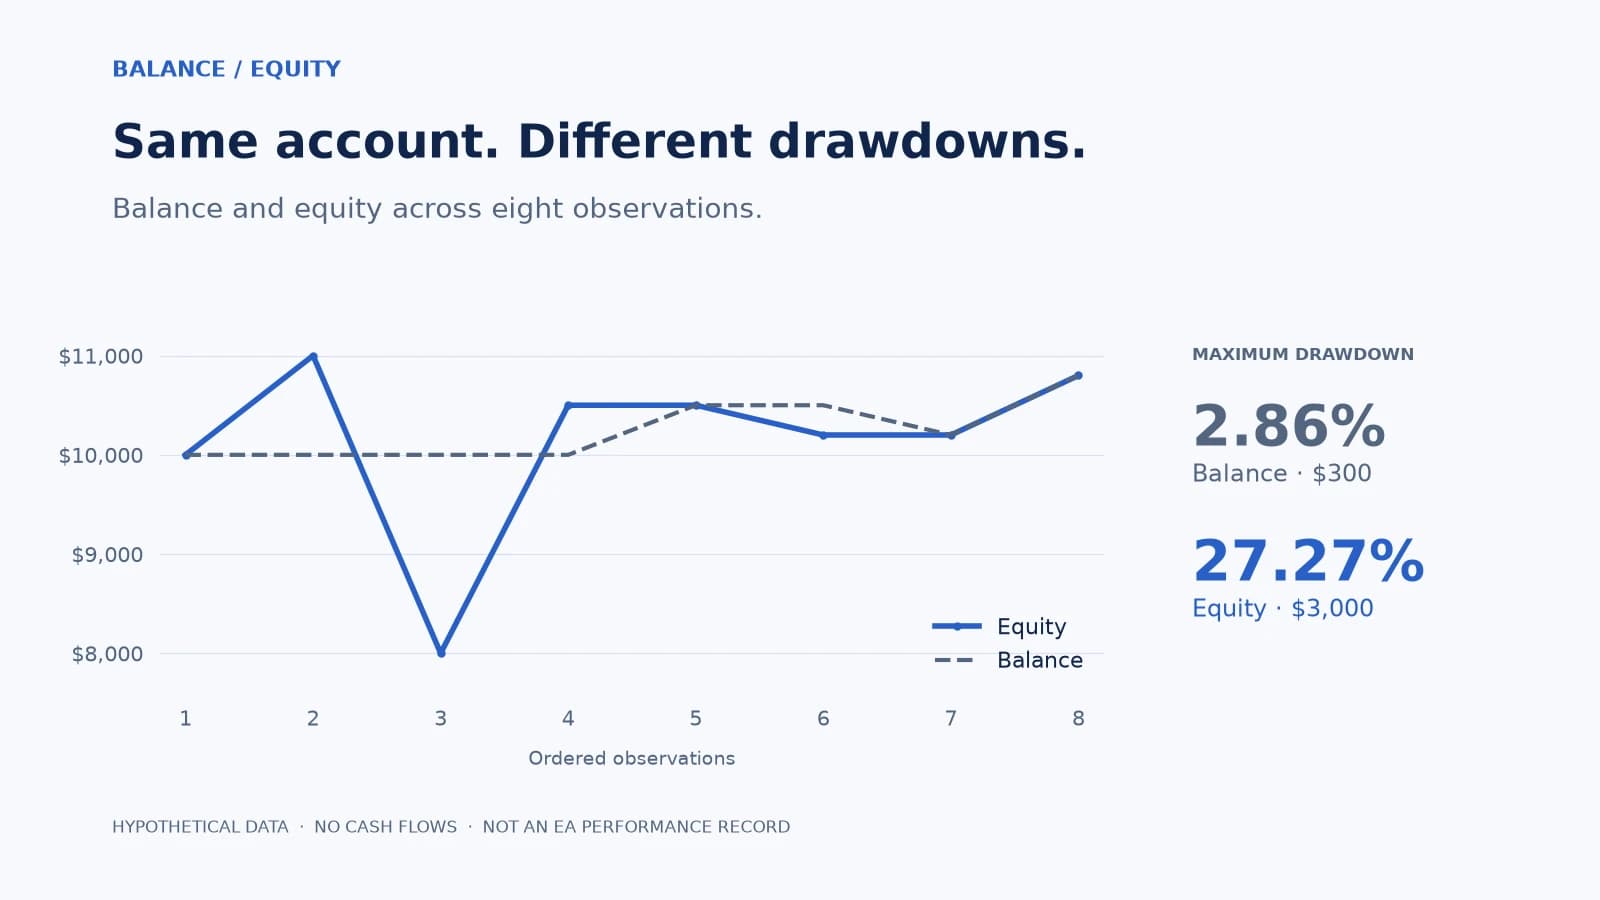
This is also why a smooth balance curve can mislead: the open basket may be carrying a large loss while settled balance barely changes. Read our equity versus balance drawdown guide before comparing screenshots.
What risk controls can and cannot do
A maximum entry count limits new exposure. It does not close the exposure already open. In our five-entry doubling example, open loss grows from $65 at a 100-pip decline to $995 at a 400-pip decline, even though volume stays at 0.31 lot.
An equity exit realizes a loss instead of waiting indefinitely. In the gradual long-trend scenario, the optional 20% starting-equity loss rule closes the doubling basket at $7,980. It crosses the $8,000 trigger between sampled quotes. A smaller trigger does not make the strategy profitable; repeated capped losses can still deplete an account.
A trigger is not a guaranteed fill price. In the gap scenario, the next quote jumps from 1.0825 to 1.0650. The same rule exits at $4,920: a 50.80% loss, despite its 20% trigger. No intermediate exit price was available in the invented quote stream. Spread widening, slippage, outages and broker execution add further uncertainty in reality. See MetaTrader's order and execution descriptions.
More leverage changes the margin constraint, not the P&L per pip for the same volume. It may allow a larger basket to be opened; it does not remove the basket's market loss. More capital likewise changes the capacity to carry positions, not proof of an edge. Forex margin calculations.
The practical question is what each rule actually does: reject new entries, close one position, liquidate the basket, disable trading, or restart immediately. These actions produce different risks.
How to check a grid or recovery EA
Before interpreting a win rate, inspect the complete basket behaviour:
- Reconstruct the entries. Record entry times, direction, prices and sizes. Increasing lots can be consistent with loss recovery, but account growth, independent signals and partial exits can also affect sizes. A setting called “multiplier” is a clue, not proof by itself.
- Find the hard boundaries. Ask for maximum total lots, number of entries, per-position/basket exits, account-level rules and what happens after an entry is rejected. Check the exact version and settings.
- Test the failure conditions. Include persistent trends, gaps, changing spreads and recovery after a restart. Preserve the full quote sequence and costs. Historical tester “forward” optimization is still a historical holdout, not a live forward test. MetaTrader optimization documentation.
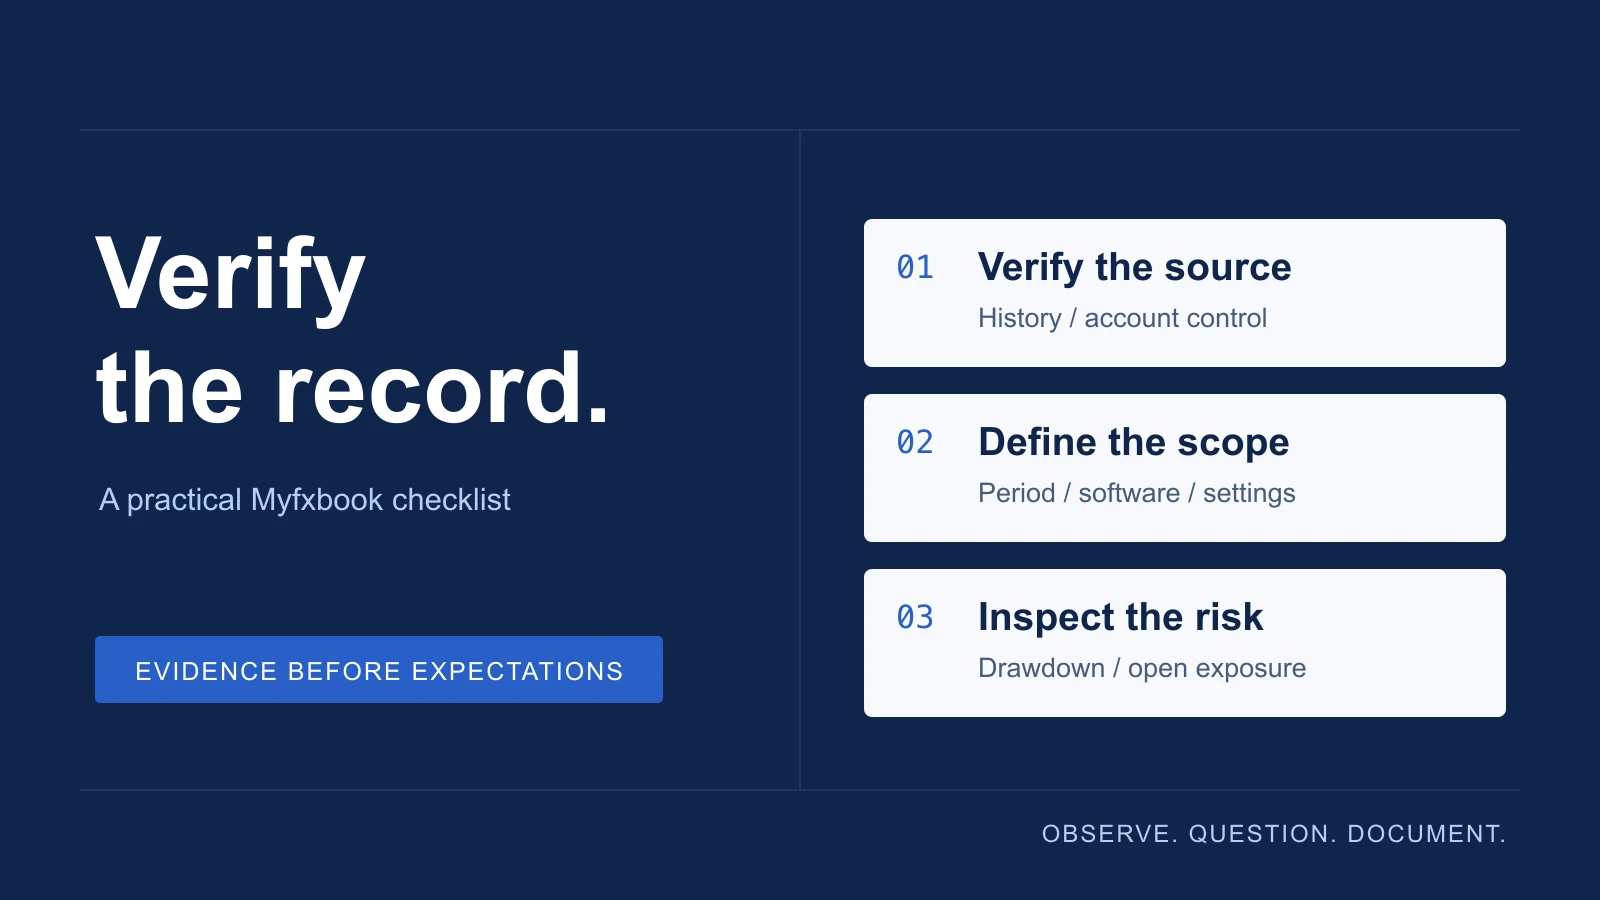
- Keep failed runs. Include liquidated accounts, unfinished baskets, open losses and deposits. Compare exposure and drawdown alongside returns, not just win rate. Use our trading-result verification guide.
- Check operational dependencies. An EA-managed equity rule may require the terminal and connection to keep working. A broker-held order is different. Ask where each rule runs and how failures are handled.
We apply these questions to our own products too. SkyWebR is our EURUSD grid EA, so we have a commercial interest in this subject. This teaching model neither reproduces its code nor validates its exits, sizing profiles or future performance. Its product record and exact supplied settings need their own assessment; the word “controlled” is not a substitute for that evidence.
Model assumptions and formulas
The interactive example is reproducible arithmetic, not a strategy tester, probability forecast or broker margin calculator. Both accounts start with $10,000 and one 0.01-lot EURUSD buy at 1.1000. Contract size is 100,000 EUR per lot; one pip is 0.0001. Additional buys are attempted every 25 adverse pips, up to five or eight entries. One basket runs per account; there is no restart after any exit.
The synthetic candles include small counter-moves within the overall decline and rebound. Each body and wick comes from the same one-pip quote sequence used to calculate orders and account values. The model visits each candle’s extremes before its close; it does not calculate trades from candle closes alone. During playback, a forming candle shows only quotes reached so far. A price gap starts a new candle with no fills inside the skipped range. The horizontal axis represents ordered quotes, not elapsed time; these are not historical market candles.
Each ordinary quote moves one pip, including the small counter-moves. The gap scenario skips directly from −175 to −350 pips relative to the initial price. Crossed entry levels fill at the next observed quote, not at nonexistent prices inside a gap. An unaffordable addition is rejected and further additions are disabled for that basket.
Scroll horizontally if needed
| Calculation | Formula in this example |
|---|---|
| Floating P&L in USD | Sum of (current price − entry price) × lots × 100,000 for all open buys |
| Equity | Balance + floating P&L |
| Average open entry | Sum of entry price × lots, divided by total open lots |
| Used margin in USD | total lots × 100,000 × current EURUSD / 30 |
| Margin level | equity / used margin × 100, when margin is nonzero |
| Drawdown | Decline from the account's highest equity observed so far |
At each quote, check existing positions for the 50% margin-level boundary first, then the optional 20% loss from starting equity, then the $10 basket-profit target. A triggered exit closes the whole basket at that quote and stops that account's simulation. If no exit occurs, eligible entries are attempted subject to available margin. Real broker stop-out may close positions in a different sequence or only partially; we deliberately simplify it to one basket exit.
Margin follows the basic Forex formula plus conversion to USD, without symbol-specific overrides. Actual MetaTrader margin rules depend on instrument, broker settings, account mode and conversion rates.
Spread, commission, swap, latency and additional slippage are all zero. Bid and ask are treated as the same quote. This makes the example optimistic on costs; small gross recoveries could disappear after actual charges. Thresholds are checked at sampled quotes, so a $10 target can close above $10 and a loss exit can close below its trigger. We do not model portfolio correlations, short positions, price-dependent margin tiers or repeated cycles. Thirty-to-one leverage and the chosen limits are teaching inputs, not recommended settings or a statement of what an account offers.
Frequently asked questions
Is grid trading the same as martingale?
No. Entry spacing and loss-dependent sizing are separate rules. An EA can use either one or combine them. Inspect actual position sizes and exits rather than relying on the product name.
Is grid trading profitable?
Some price paths produce profitable baskets. Whether a particular system is profitable over a relevant period after costs depends on its signals, sizing, exits, market conditions and execution. These three hand-selected paths cannot answer that question or estimate a win rate.
Does martingale guarantee recovery?
No. Increasing the next trade's size does not guarantee a winning trade, an executable entry, sufficient margin or a rebound before an exit. The idealized promise depends on resources and execution that a real account cannot supply indefinitely.
Is a fixed-lot grid safe?
Fixed sizing removes the geometric lot multiplier. It does not remove accumulating positions, open losses or the possibility of exhausting the account's risk budget. Compare total volume and exit behaviour, not just the first lot size.
Can a stop loss make martingale safe?
A functioning exit changes the loss distribution and can stop a recovery sequence earlier. It cannot guarantee its execution price or create positive expectancy. The gap example demonstrates why a configured trigger and a realized loss are different quantities.
Do withdrawals prevent a grid account from crashing?
Withdrawals reduce the capital left in the trading account and do not alter the strategy's recovery mechanics. To evaluate the full economic result, include deposits, withdrawals, remaining equity and failed accounts together. Taking money out is not evidence that the remaining account is safe.

Sources & further reading
Your next question