Learn
Equity Drawdown vs Balance Drawdown: EA Risk Explained
At a glance
Balance drawdown measures a decline in settled account balance. Equity drawdown measures a decline in account value including open-position profit and loss. For peak-to-trough drawdown, compare each curve with its own earlier high. A profitable closing balance can hide a much deeper equity decline during open trades. Check the report type, observation frequency, costs and cash-flow treatment before comparing percentages. Prop-firm loss limits are separate rules.
On this page
An EA can finish with a higher balance after carrying a large open loss. If you only inspect the trades that eventually closed, you may miss how far the account's equity fell along the way.
This guide explains historical drawdown when evaluating MT4 or MT5 trading results. We also separate it from similarly named prop-firm rules. The calculations below use an original, explicitly hypothetical dataset. They do not describe a tested trading strategy or recommend an acceptable risk level.
Platform and methodology references were checked on 21 September 2026. RoboXpert develops trading software; AI assisted with research, implementation and drafting. See our editorial methodology and disclosure.
What is the difference?
Balance is the settled account amount; it excludes the current result of open positions. Equity includes those open-position results and relevant account adjustments. Balance can also change through deposits, withdrawals, charges and credits—it does not move only when a trade closes. MetaTrader's account-state definitions describe the distinction.
For a simplified account without credit or other adjustments:
Equity = balance + floating profit or loss.
A $10,000 balance with a $2,000 open loss therefore has $8,000 equity. That is an account snapshot. To calculate drawdown, you also need the earlier reference value and the measurement rule.
Scroll horizontally if needed
| Question | Balance drawdown | Equity drawdown |
|---|---|---|
| Which curve falls? | Settled account balance | Account equity, including floating results |
| Which peak is used for peak-to-trough measurement? | The balance curve's own earlier high | The equity curve's own earlier high |
| Does an open position's changing P&L enter the curve? | No; separately booked charges can still change balance | Yes, when the equity observation records it |
| What can the figure help reveal? | Declines in settled results | Declines experienced while positions were still open |
| What does it not establish? | The worst floating exposure | Every unobserved intraperiod low or a future loss ceiling |
The simple equity equation is a teaching approximation. MetaTrader's full account definition also handles credit, commissions and blocked amounts. Avoid subtracting a charge twice if it is already reflected in the reported account values.
One account, two drawdown histories
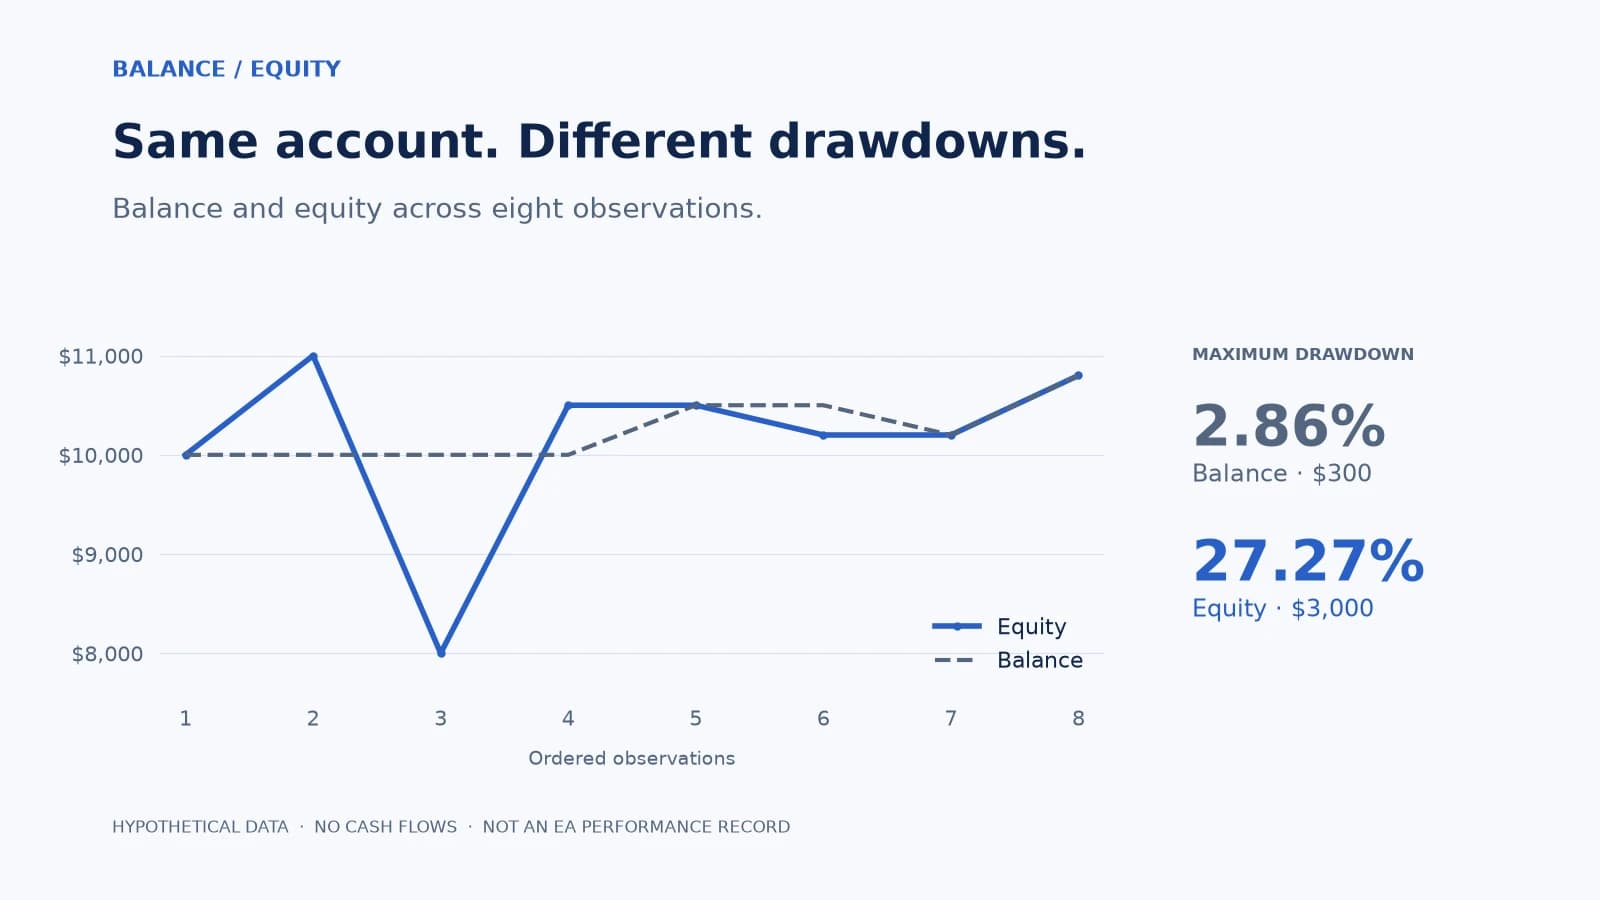
Our example starts with $10,000, ends with $10,800, and includes eight ordered observations. During the first open trade, equity rises to $11,000 before falling to $8,000. It later recovers, and that trade closes in profit. A subsequent trade closes at a loss.
Hypothetical example · USD · no deposits or withdrawals
One account. Two different histories.
Observations 1–8. Connecting lines are illustrative, not measured prices between observations.
- Balance
- $10,000
- Equity
- $8,000
- Balance drawdown now
- 0.00%
- Equity drawdown now
- 27.27%
The same position is now $2,000 in loss. Equity has fallen $3,000 from its earlier peak: 27.27%, not 20%.
All eight observations and calculations
These invented observations are the complete dataset for this example. They are not a backtest, broker statement or product result. Both peaks start at $10,000. Fees, credit and cash flows are excluded; “flat” means no position is open.
| Observation | Balance | Equity | Balance DD | Equity DD | Flat? |
|---|---|---|---|---|---|
| 1. Start | $10,000 | $10,000 | 0.00% | 0.00% | Yes |
| 2. Open profit | $10,000 | $11,000 | 0.00% | 0.00% | No |
| 3. Floating low | $10,000 | $8,000 | 0.00% | 27.27% | No |
| 4. Recovery | $10,000 | $10,500 | 0.00% | 4.55% | No |
| 5. Close winner | $10,500 | $10,500 | 0.00% | 4.55% | Yes |
| 6. Next trade | $10,500 | $10,200 | 0.00% | 7.27% | No |
| 7. Close loser | $10,200 | $10,200 | 2.86% | 7.27% | Yes |
| 8. Finish | $10,800 | $10,800 | 0.00% | 1.82% | Yes |
Across the complete sequence:
- Balance maximum drawdown: $10,500 → $10,200, a $300 decline, or 2.86%.
- Equity maximum drawdown: $11,000 → $8,000, a $3,000 decline, or 27.27%.
- Ending result: both curves finish at $10,800, 8% above the starting amount.
The gains at the end do not erase the earlier decline. These are different questions: where the account finished, and how far it fell from a prior peak.
What if we only keep the closed-position observations?
Keep only rows 1, 5, 7 and 8, when the account is flat. Both sampled curves become $10,000 → $10,500 → $10,200 → $10,800. Their maximum observed drawdown is now 2.86%. The intermediate $11,000 peak and $8,000 low have both vanished from the sample.
This is a controlled illustration of missing observations. It does not mean that all reports omit open-trade equity, or that every coarse sample understates risk by the same amount. It means that a closing-results list cannot, by itself, establish what happened between those closes.
How to calculate drawdown
For a sequence without deposits or withdrawals, track each curve's running peak separately. At observation t:
Peak(t) = highest observed value of that curve up to t
Drawdown amount(t) = Peak(t) - Current value(t)
Drawdown %(t) = Drawdown amount(t) / Peak(t) × 100
Maximum drawdown % = largest Drawdown % in the observed period
This percentage requires a positive reference peak. An account reaching zero equity represents a 100% decline from a positive peak; negative equity can exceed 100%. Our interactive example deliberately uses positive values throughout.
Why a 20% floating loss can mean 27.27% equity drawdown
At row 3, the open loss is $2,000 relative to a $10,000 balance: 20%. But the earlier equity peak was $11,000, not $10,000:
($11,000 − $8,000) / $11,000 × 100 = 27.27%.
The gap from balance to equity and the decline from peak equity are different calculations. Calling both “floating drawdown” without a formula makes the number ambiguous.
Largest dollar decline and largest percentage decline can differ
Consider a second, invented sequence: $10,000 → $8,000 → $20,000 → $17,000. There are no cash flows; all changes are assumed trading results.
Scroll horizontally if needed
| Episode | Currency decline | Percentage decline |
|---|---|---|
| $10,000 → $8,000 | $2,000 | 20% |
| $20,000 → $17,000 | $3,000 | 15% |
The largest currency decline is $3,000, paired with 15%. The largest percentage decline is 20%, paired with $2,000. Reporting “$3,000 (20%)” would combine two different episodes. This distinction is also explicit in the MQL5 testing-statistics reference.
Read the MT5 report labels
Identify the document first: a Strategy Tester report, a trading-history report, and a third-party dashboard are different records. Do not infer their measurement methods from a similar-looking graph.
MT5's official testing-report reference describes the detailed report under Results. Find the balance and equity rows and compare like with like:
Scroll horizontally if needed
| MT5 label | Read it as |
|---|---|
| Balance Drawdown Absolute | The shortfall of the lowest balance below the initial deposit, if any |
| Equity Drawdown Absolute | The corresponding shortfall for equity |
| Balance Drawdown Maximal | Largest balance decline in account currency; its matching percentage is in brackets |
| Equity Drawdown Maximal | Largest equity decline in account currency; its matching percentage is in brackets |
| Balance Drawdown Relative | Largest balance percentage decline; its matching currency amount is in brackets |
| Equity Drawdown Relative | Largest equity percentage decline; its matching currency amount is in brackets |
In our first dataset, equity's absolute shortfall below the initial $10,000 is $2,000. Its maximum peak-to-trough decline is $3,000. Balance never falls below its initial $10,000, so its absolute shortfall is zero, despite a later $300 decline from its own peak.
For developers, the MQL5 statistics identifiers distinguish the maximum currency decline from the maximum percentage decline and retain the companion value for each episode. The two pairs need not match.
MT4 readers: do not expect an identical six-field layout. Check the MT4 Strategy Tester report documentation, the exact report type and the build that produced your file. A generic “drawdown” label should not be re-labelled “balance only” without checking its definition.
Why reports can disagree
Before comparing two percentages, check what each calculation observed.
Different observation frequency
A once-per-day equity series can miss an intraday low. More frequent observations can reveal additional extremes; the recorded maximum still depends on the available data. A screenshot of a smooth curve does not establish that every intervening account value was sampled.
To reconstruct an equity history, closed trades alone are insufficient. You also need the prices used to value positions while they were open, overlapping exposure, relevant currency conversions, costs and cash-flow events. Reconstruction assumptions should be documented, not presented as a complete measured history.
Myfxbook's headline and chart use different inputs
Myfxbook documents end-of-day, intraday-at-update and growth drawdown. Its headline account statistic takes the largest of these; the drawdown chart uses end-of-day and growth calculations. A headline larger than the chart's visible lows therefore has a documented explanation. Myfxbook's methodology also makes the observation timing relevant.
Use our Myfxbook verification guide for account identity, hidden information and the limits of verification. Do not assume its percentage is the same metric as an MT5 tester field.
Deposits and withdrawals change raw account values
A withdrawal from $10,000 to $8,000 with no trades produces a 20% fall in the raw cash balance. It is not a $2,000 trading loss. A deposit can raise the raw account value without trading profit. Both can distort a naive peak-to-trough comparison.
Check whether the provider adjusts cash flows, segments the calculation or uses a return series. Our example excludes external flows. MT5 documents specific treatment of tester withdrawals, so a generic calculation should not be assumed to reproduce every platform report.
Different periods and configurations
The same EA name does not mean the same experiment. Dates, instruments, position sizes, simultaneous positions and costs all affect the path. Compare only after these differences are explicit. A shorter record can simply omit a difficult period.
A drawdown statistic is not a prop-firm rule
A historical statistic answers “How far did this recorded curve fall?” A contractual loss rule answers “Which account value may not cross which threshold, and when?”
Separate three parts of a rule:
- Reference: initial balance, a daily snapshot or a moving peak.
- Breach value: balance, equity or another defined calculation.
- Timing: intraday checks, end-of-day adjustments, reset time and timezone.
A limit derived from balance can still be breached by floating losses if equity is the monitored value. For example, FTMO's currently documented 1-Step maximum-loss rule derives an end-of-day trailing limit from balance but tests equity against that limit. Check the exact program's current trading objectives.
“Balance-based” alone therefore does not establish that open losses are ignored. Read the actual rule instead of applying the definitions of a report statistic to a funded-account contract.
What to ask before trusting an EA's drawdown
Ask the provider for a description that makes the figure reproducible:
- Metric and source: balance or equity; absolute, maximal or relative; which platform/report?
- Coverage: full start/end dates, sampling frequency and missing intervals.
- Configuration: EA version, inputs, instruments and position-sizing rules.
- Accounting: costs, swaps, credit and treatment of deposits or withdrawals.
- Exposure: what was open at the trough, and whether the record ended with open positions.
A gap between balance and equity is a reason to inspect the path. It is not, by itself, proof of manipulation, a particular strategy type or future failure. The broader EA selection guide connects this evidence to compatibility, trading logic and operational responsibilities.
Frequently asked questions
Can an EA show profit while equity is below the starting balance?
Yes. Closed trades can leave a profitable balance while open losses pull equity below the starting amount. That is why a settled-profit total and an account-equity observation should be read together.
Is equity drawdown always greater than balance drawdown?
No universal ordering should be assumed across different reports, periods or definitions. Even on the same timeline, each curve has its own peaks and overlapping positions can offset realized losses. For a simple hypothetical illustration, balance values of $10,000, $12,000, $10,000 and $11,000 have a 16.67% drawdown; equity values of $10,000, $11,000, $11,000 and $11,000 have none. This assumes offsetting open results of $0, −$1,000, +$1,000 and $0, with no external flows. Calculate both instead of asserting an inequality.
Is a 20% drawdown acceptable?
The percentage alone cannot answer that. Its meaning depends on how it was measured, the strategy, sizing, costs, sample and the account's constraints. This guide provides no universal safe threshold. A past maximum is an observed result, not an enforced cap on future losses.
How much gain is needed to recover from a drawdown?
With no cash flows, divide the loss fraction by the remaining fraction: recovery gain = d / (1 − d). A 20% loss requires 25% growth from the reduced amount; a 50% loss requires 100%. These are arithmetic relationships, not return forecasts. At a 100% loss, recovery by a percentage gain on the remaining zero balance is undefined.
Does closing a losing position remove the drawdown?
It changes an open result into a realized result. In the simplified model, closing at the currently marked price leaves equity unchanged and reduces balance; additional execution costs can change that outcome. The earlier historical peak-to-trough decline remains in the record.

Sources & further reading
Your next question