Learn
Claude vs GPT: Which AI Writes the Better MT5 Indicator?
At a glance
In our test neither AI wrote the better MT5 indicator: Claude Opus 5.5 and GPT-6 Astra got the same prompt and ended level on every check against the written rule. In round 1 both indicators compiled at once and placed all 1,163 signals correctly. Round 2 added an hourly trend filter: both versions were correct on the chart and showed no signal at all in the Strategy Tester, for two different reasons. Each model found and fixed its own bug after one report. The model mattered less than the test.
On this page
We asked two AI models to write the same MT5 indicator from the same prompt and tested what came back. The short answer: on the chart you cannot tell them apart. Claude and GPT both delivered a correct indicator on the first try. A harder second task broke both, in two different ways that only the Strategy Tester revealed.
So if you are looking for the best AI for MQL5 coding, this test names no winner. It shows where AI-written MQL5 code fails and how you find that failure before you rely on a signal.
How the test worked
Both models got the same first message in a new, empty session: no project files, no saved instructions, no memory of earlier chats. The message told them to answer as a plain chat assistant, without tools or web search. We saved each answer unchanged and compiled its code block as it was. The table lists the two models and how we reached them.
Scroll horizontally if needed
| Claude | GPT | |
|---|---|---|
| Model | Claude Opus 5.5 (Anthropic) | GPT-6 Astra (OpenAI, model ID gpt-6-astra), reasoning effort high |
| Access | Claude Code 2.1.282, command line | Codex CLI 0.159.2, signed in with a ChatGPT account |
| Date | 2 October 2026 | 2 October 2026 |
The test had three rounds: a signal indicator, an added trend filter from a higher timeframe, and one defect report. We checked every version in two ways:
- On the chart history. A script exported the terminal’s own EMA and RSI values for 68,441 EURUSD M15 bars. A Python script applied the written rule to those values and compared the result with each indicator’s buffers. It never reads the indicator source.
- Tick by tick in the Strategy Tester. A small EA loaded each indicator with
iCustomand read its buffers on each of 4,441,960 real ticks, from 1 July to 29 September 2026. It recorded what a bar showed at the moment it closed, any signal on the unfinished bar and any bar that changed later.
One answer per model and round is a small sample. The same prompt can produce different code tomorrow. Read the results as one documented run.
Round 1: a signal MT5 indicator from one prompt
The indicator, “RX Trend Signal”, draws buy and sell arrows. The prompt fixed the rule, the input names and the buffer order, so that both results could be read by the same test program. The table shows the rule; the full prompt is in the download.
Scroll horizontally if needed
| Part | Rule |
|---|---|
| Trend | The close is at least 20 points beyond the 50-period EMA, and the EMA is higher (or lower) than five bars earlier |
| Trigger | RSI(14) crosses above 55 for a buy, below 45 for a sell |
| Signal | Trend and trigger on the same closed bar |
| Alternation | After a buy, no further buy until a sell has occurred, and the other way round |
| Repainting | Never a signal on the unfinished bar; a closed bar never changes |
| Buffers | 0: buy arrow below the low, 1: sell arrow above the high, 2: the EMA line |
| Alerts | One alert per signal on a bar that closes while the indicator runs |
It is our own teaching rule for a common kind of signal indicator. It is not the logic of our 3B Indicator, which is separate commercial software.
Both answers compiled in MetaEditor build 6230 with zero errors and zero warnings. The table shows the checks on EURUSD M15: the chart history from March 2024 to September 2026 and the tester run from July to September 2026. Both indicators placed every signal exactly where the rule puts it.
Scroll horizontally if needed
| Check | Claude | GPT |
|---|---|---|
| Signals on the chart history that match the rule | 1,163 of 1,163 | 1,163 of 1,163 |
| Signals in the tester that match the rule | 109 of 109 | 109 of 109 |
| Signals shown on the unfinished bar | 0 | 0 |
| Bars that changed after their close | 0 | 0 |
| Alerts, and duplicates among them | 109, 0 | 109, 0 |
Chart screenshots of the two indicators over the same window are identical pixel for pixel. A task of this size, with a precise prompt, was no problem for either model.
Round 2: the hourly trend filter
The second prompt went into the same session. It added one filter: a buy needs the last completed hourly bar to close above its own 50-period EMA, a sell needs it below. The prompt spelled out the trap that makes many multi-timeframe indicators repaint: “Never use a TrendTimeframe bar that is still forming at that moment.”
Again both sources compiled without a warning. On the chart history both matched the rule on all 438 signals. Neither used a forming hourly bar.
Then came the tester run. The table repeats the checks for version 2, again on EURUSD M15 from July to September 2026: correct on the chart, empty in the tester.
Scroll horizontally if needed
| Check | Claude version 2 | GPT version 2 |
|---|---|---|
| Signals on the chart history that match the rule | 438 of 438 | 438 of 438 |
| Signals in the tester, of 51 the rule has | 0 | 0 |
| Alerts in the tester | 0 | 0 |
| Run time of the same tester run | 18 min 30 s | 11 min 35 s |
Both indicators drew their EMA line in the tester and not one arrow in three months. Version 1 had finished the same run in about two seconds. No error appeared in the journal.
The causes were different. We found them with instrumented copies of both sources:
- Claude’s version waited for an answer it never asked for. It checked whether the hourly EMA was fully calculated before it requested any hourly EMA value. MetaQuotes documents that “in the Strategy Tester, indicators are calculated only when they are accessed for data”. Source: MQL5 testing. So the check failed on every tick, and the indicator stopped at the first bar that needed the hourly trend.
- GPT’s version demanded history that does not exist. It required 50 hourly bars before every chart bar. In the tester, chart history and hourly history begin on the same date. The oldest chart bars could never meet the condition, and the indicator answered “not ready yet” for the whole test.
On a live chart with long history neither defect shows. That is why the chart check passed and why this kind of bug survives a quick look.
GPT’s defect was written down in its own answer. Its list of assumptions said: “Missing higher-timeframe history, including EMA warm-up data, causes a retry.” Claude’s answer had seen exactly that danger and avoided it: bars older than the hourly history “get no HTF trend and therefore no signal. Treating them as ‘not ready’ would stop the indicator forever.” Claude then failed on the other trap.
Round 3: one defect report, one fix
We told each model what we had observed and nothing about the cause. This is the core of the report to Claude. GPT’s report said 0 instead of 97; the full texts are in the download.
On a live chart (EURUSD, M15, about 100,000 bars) version 2 draws the EMA
line and the expected arrows.

In the MetaTrader 5 Strategy Tester it draws the EMA line but not a single
arrow, and it raises no alert. We loaded it from an Expert Advisor with
iCustom, read buffers 0 and 1 with CopyBuffer on every tick and ran three
months of real ticks (EURUSD, M15, 1 July to 29 September 2026). Version 1
showed 109 signals in the same test. For version 2, BarsCalculated() of the
indicator stays at 97 for the whole test.

In the tester the chart history and the higher-timeframe history begin on
the same date (2 January 2025). No error is printed in the journal.

Find the cause and fix it.
Each model named the cause we had measured in its own code. Claude called it “a deadlock in my code” and added: “This fits everything you saw, but I can’t confirm it without running the test.” GPT wrote that its version “mistakes historical EMA warm-up for temporarily missing data”.
Both fixes compiled. The table shows the same checks for version 2.1; this time both indicators passed all of them.
Scroll horizontally if needed
| Check | Claude version 2.1 | GPT version 2.1 |
|---|---|---|
| Signals on the chart history that match the rule | 438 of 438 | 438 of 438 |
| Signals in the tester that match the rule | 51 of 51 | 51 of 51 |
| Signals shown on the unfinished bar | 0 | 0 |
| Bars that changed after their close | 0 | 0 |
| Alerts, and duplicates among them | 51, 0 | 51, 0 |
| Run time of the tester run | 2.4 s | 1.7 s |
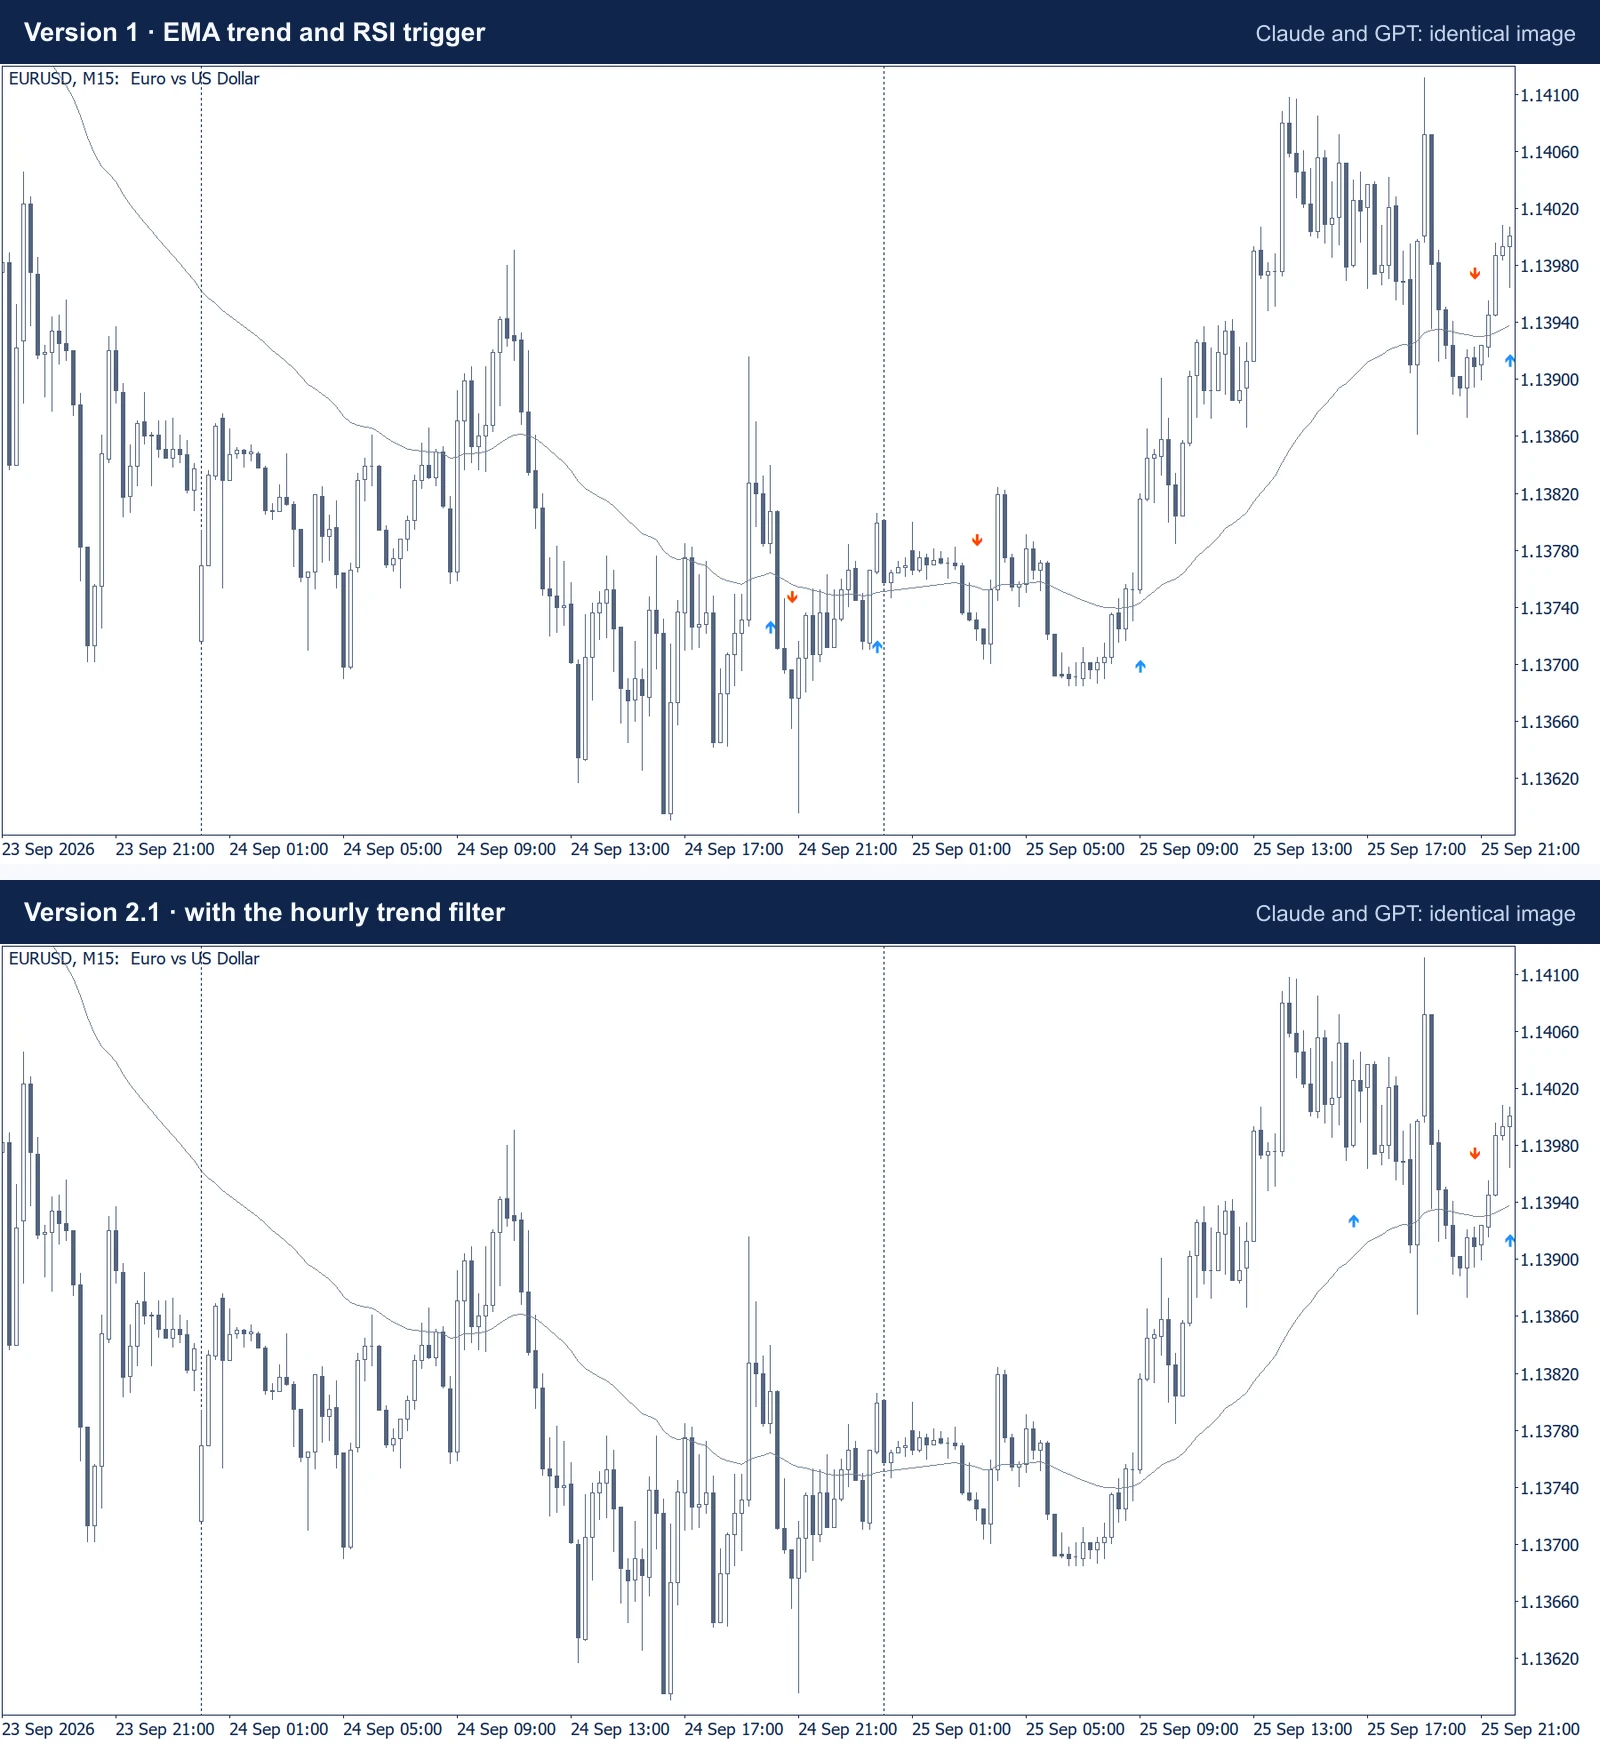
The figure shows what a user sees: the same arrows from both models. With the hourly filter this window has three signals where version 1 had seven.
One small difference remained. In the tester’s visual mode, Claude’s version 2.1 showed one signal a tick late: the bar of 25 September at 20:45, which ends exactly on the hour. Claude’s code waits until the next hourly bar exists, and it had announced this in its assumptions: “a signal can therefore appear one tick later than the chart bar’s close.” GPT’s version computes the end of the hourly bar from the clock and showed the signal on the first tick. Without visual mode neither version was late.
Claude vs GPT: the results side by side
The table collects what actually differed between the two models in this run. The checks themselves ended in a tie.
Scroll horizontally if needed
| Claude Opus 5.5 | GPT-6 Astra | |
|---|---|---|
| Round 1, first answer | Correct | Correct |
| Round 2, first answer | Correct on the chart, no signal in the tester | Correct on the chart, no signal in the tester |
| Cause of the round 2 defect | Checked the hourly EMA before requesting it | Treated missing warm-up history as “not ready yet” |
| Round 3, fix after one report | Correct, cause named | Correct, cause named |
| Source lines: version 1, 2, 2.1 | 297, 517, 590 | 404, 623, 663 |
| Text around the code in round 1 | 968 words, 13 assumptions in a table | 276 words, 9 assumptions as a list |
| “I have not compiled or tested this” | Stated in every answer | Not stated; no claim of testing either |
| Added to the fix | A journal message when the indicator waits too long | A note that alerts do not run in the tester |
Claude wrote more around the code and less code. GPT wrote more code and less around it. Neither habit predicted which answer would work.
GPT’s note on alerts matches the documentation, which says the Alert() function “does not work in the Strategy Tester”. Source: MQL5 Alert. In our runs with build 6230 each alert text still appeared as a line in the tester journal. That is how we counted them; no alert window was involved.
What this means for your own MT5 indicator
The practical lessons do not depend on the model.
- Fix the interface in the prompt. Input names, their order and the buffer numbers were given. That made both results testable by one program and usable from an EA through
iCustom. - Test the history and the ticks. A chart shows you a finished calculation over old bars. It cannot show a signal that appears late, vanishes or never arrives while the indicator runs. Both round 2 defects were invisible on the chart.
- Run it in the Strategy Tester even if you only want arrows. Sooner or later someone loads the indicator from an EA. The tester calculates indicators on demand and starts all timeframes on the same date. Both conditions are rare on a live chart and normal there.
- Read the list of assumptions. Ask for it in the prompt. GPT’s defect was one of its stated assumptions, and Claude’s late tick was one of its own.
- Report what you observed. A measured symptom was enough for both models. Our guess at the cause was not needed and could have sent them the wrong way.
The same method, applied to a trading program with orders, is in our guide to building an MT5 EA with AI.
Where is Gemini?
Gemini is not in this round. We run each model from the command line to get a clean session, and Google’s command-line client refused our private account on 2 October 2026 with the message “This client is no longer supported for Gemini Code Assist for individuals”. We will add Gemini when we can run it under the same conditions as the other two.
Download and reproduce
Reader resource · ZIP
Claude vs GPT indicator test: prompts, answers, sources and checks
All three prompts, the six unchanged answers, six MQL5 sources, the tester probe, the export script, the Python comparison and its results. No executable, no account data.
Download the test materialThe ZIP contains the three prompts, all six answers, the six MQL5 sources, the compiler results, the tester journal lines, the export script, the tester probe and the Python comparison with its results. The README lists the exact commands and the limits of the test: one symbol, one timeframe, one demo server and default inputs only.
To compile and attach the indicators, follow the folder route in our MT5 installation guide; indicators go into MQL5/Indicators instead of MQL5/Experts. If you prefer an existing product to building one, our 3B Indicator is commercial software from the person behind RoboXpert. It was not part of this test, and nothing here says anything about its signals.

Sources & further reading
Your next question