Learn
How to Check if a TradingView Indicator Repaints: A Practical Test
At a glance
Record what the indicator shows while a bar is open, after it closes and after reloading the same chart. Check when a marker first becomes known, not just where it ends up. Our Pine experiment separates provisional signals, confirmed signals and pivots plotted two bars into the past. A short test can reveal a problem; it cannot certify every future signal.
On this page
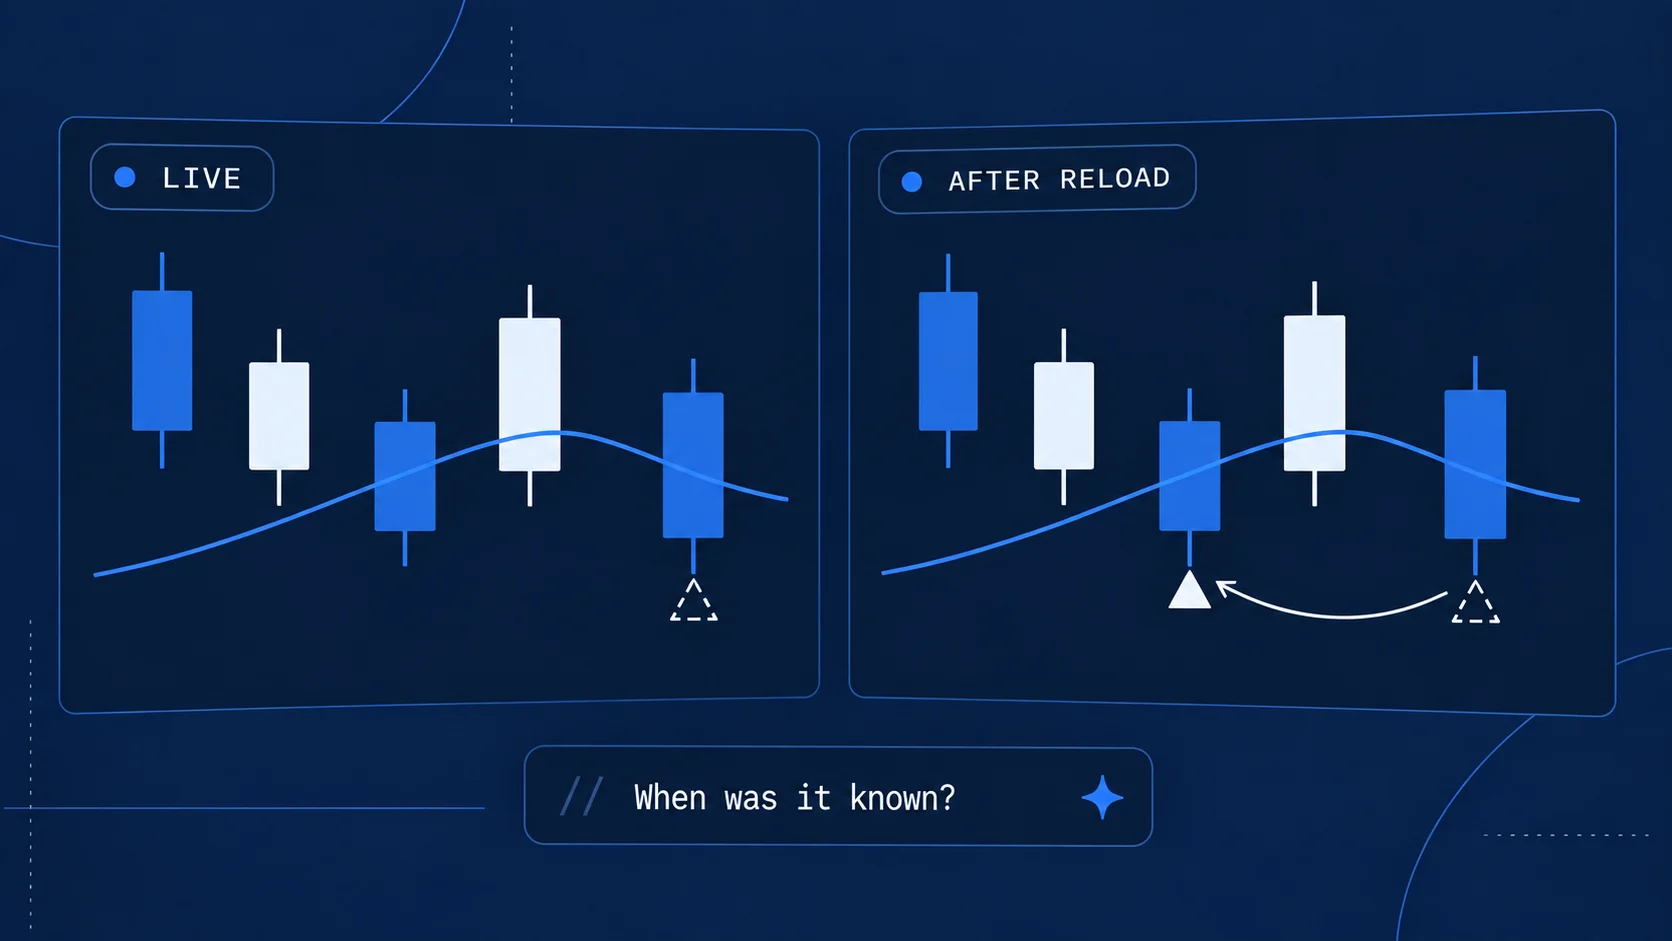
A chart can show a perfectly placed signal without proving that the signal was available at that time. To check whether a TradingView indicator repaints, you need a record of what appeared before the outcome was known.
The useful question is specific: what changed, on which bar, and when could you first have acted on that information? This guide gives you a test you can run with or without source code, followed by our own Pine Script experiment and its original chart captures.
First identify the kind of change
TradingView uses repainting broadly for differences between historical and realtime calculations or plots. Updating an unfinished candle is not automatically deceptive. A problem arises when the displayed history implies earlier knowledge than the indicator actually supplied. TradingView’s definition and examples.
Use these distinctions when recording a result:
Scroll horizontally if needed
| What you see | Question to investigate |
|---|---|
| A signal appears and disappears on the open candle | Was it explicitly provisional, or was a confirmed signal promised? |
| A closed-bar marker changes after reload | Were data, settings and script version identical? |
| A marker appears on a candle several bars back | When did the code first have enough information to draw it? |
| A signal depends on a higher timeframe | Had that source candle also closed? |
| The chart changes after an input or version change | Can you reproduce the difference without changing the configuration? |
A moving line, a delayed pivot and a future-data leak are different findings. Writing only “repaints: yes/no” loses the explanation a reader or developer needs.
Set up a comparison that means something
Before watching a signal, record the full symbol including exchange, candle type, chart timeframe, chart timezone, indicator name/version and every input. Use standard candles for the first controlled test. Keep the same saved layout and data source for the reload comparison.
Choose the behavior you expect in advance. For example: “The square must remain absent while this one-minute candle is open, then appear only if close is above EMA at confirmation.” That gives you something falsifiable. “The indicator looks accurate” does not.
Preserve the candle’s opening timestamp separately from the wall-clock time of your observation. Our example’s chart uses UTC+2, while its small live table explicitly uses UTC. Mixing those clocks would make the same candle look like two different observations.
If a closed-source indicator exposes no version, record the displayed name and test date and mark the version unknown. You can observe its behavior, but cannot inspect the hidden implementation or guarantee it remained unchanged.
Run the test without source code
- Watch an open candle. Save a screenshot or recording when a candidate marker appears. Include the symbol, timeframe, candle timestamp and settings. Record the displayed values rather than relying on the marker’s colour alone.
- Wait for its closing update. Inspect the same candle after a new candle begins. Note whether the marker stayed, vanished, changed position or first appeared at confirmation.
- Reload the saved chart. Return to the exact timestamp with the same inputs. Compare the closed candle’s values and markers with the earlier capture.
- Watch where new markers are placed. A symbol added to an older candle is a timing finding even if it never subsequently moves. Record both the marked candle and the first observation time.
- Repeat across relevant boundaries. Include new sessions and any higher-timeframe close used by the indicator. Keep each observation separate; do not turn an uneventful short sample into a universal guarantee.
If something differs, first rule out a changed input, symbol, chart type, script version or revised source data. Preserve the discrepant images before changing anything. “Different after reload” describes an observation; it does not by itself identify the cause.
Our live-bar experiment
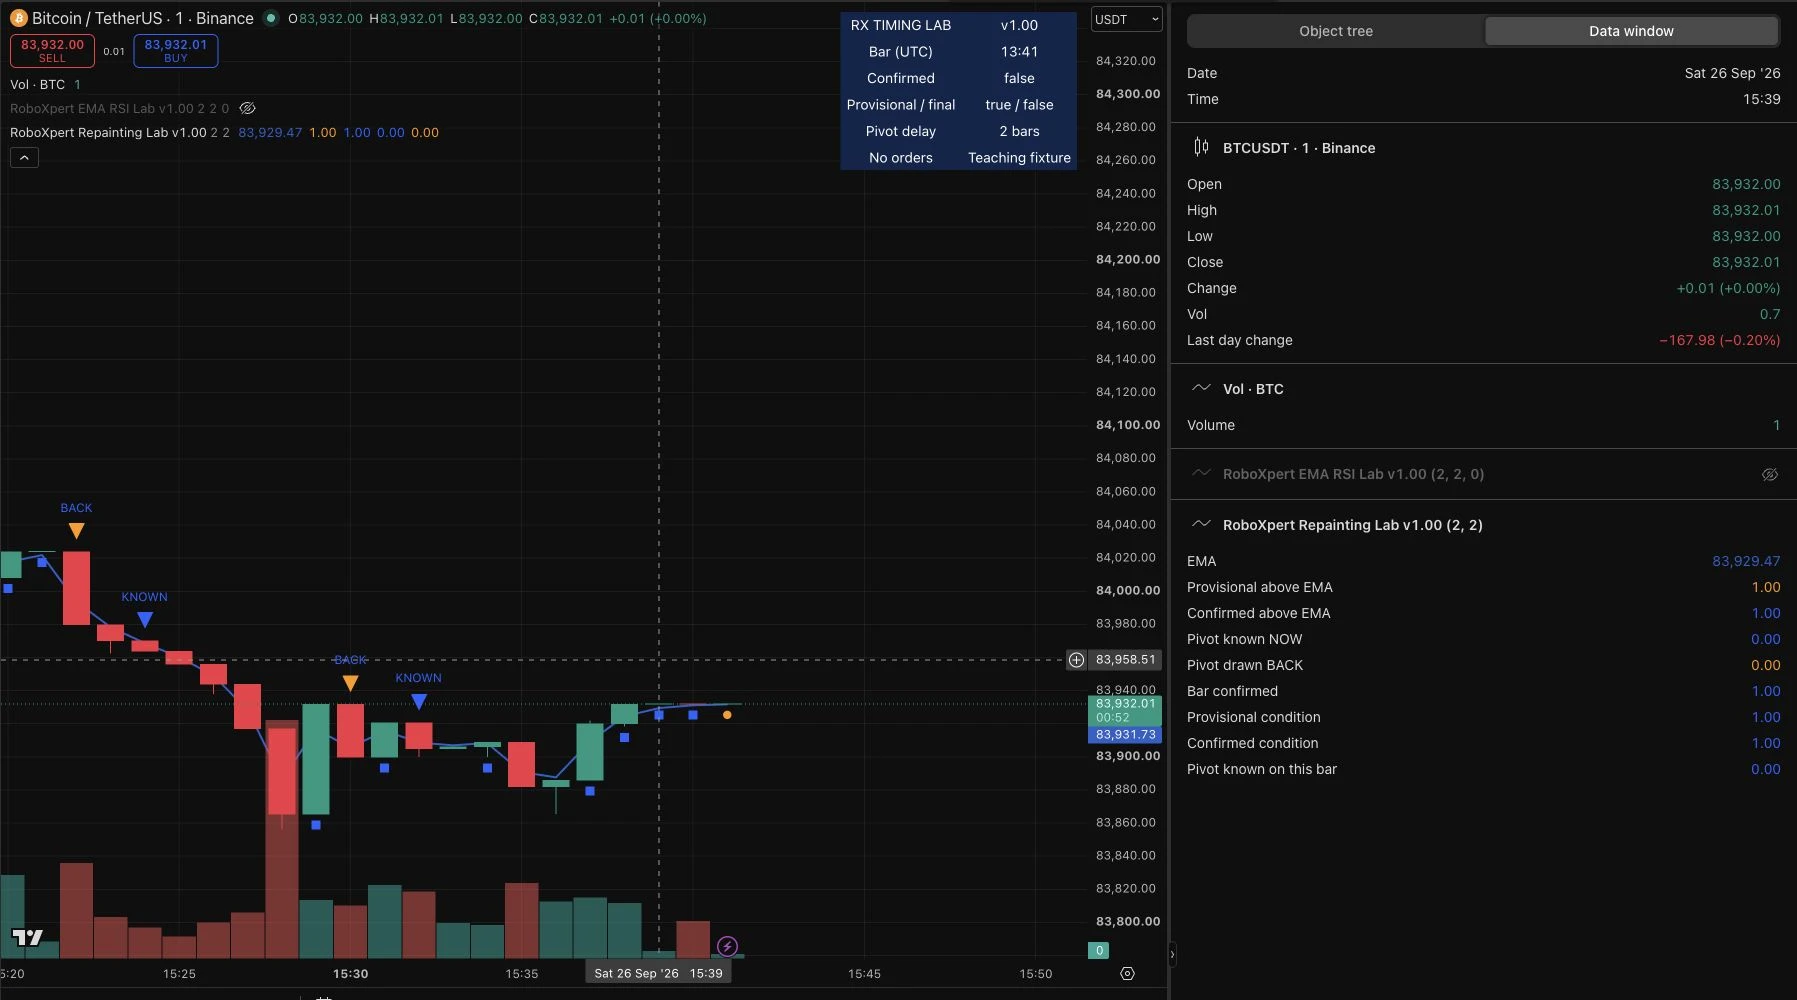
We created RoboXpert Repainting Lab v1.00, an original Pine v6 teaching indicator with AI assistance. We added it successfully to TradingView on 26 September 2026, using BINANCE:BTCUSDT, standard 1-minute candles, EMA length 2 and pivot left/right length 2. It contains no strategy or order code.
The first part deliberately exposes two states:
ema = ta.ema(close, 2)
raw = close > ema
confirmed = barstate.isconfirmed and raw
The orange circle represents raw; the blue square represents confirmed. This is an above-EMA condition, not the crossover-plus-RSI rule in our AI indicator tutorial. The short length is a test input, not a recommended trading setting.
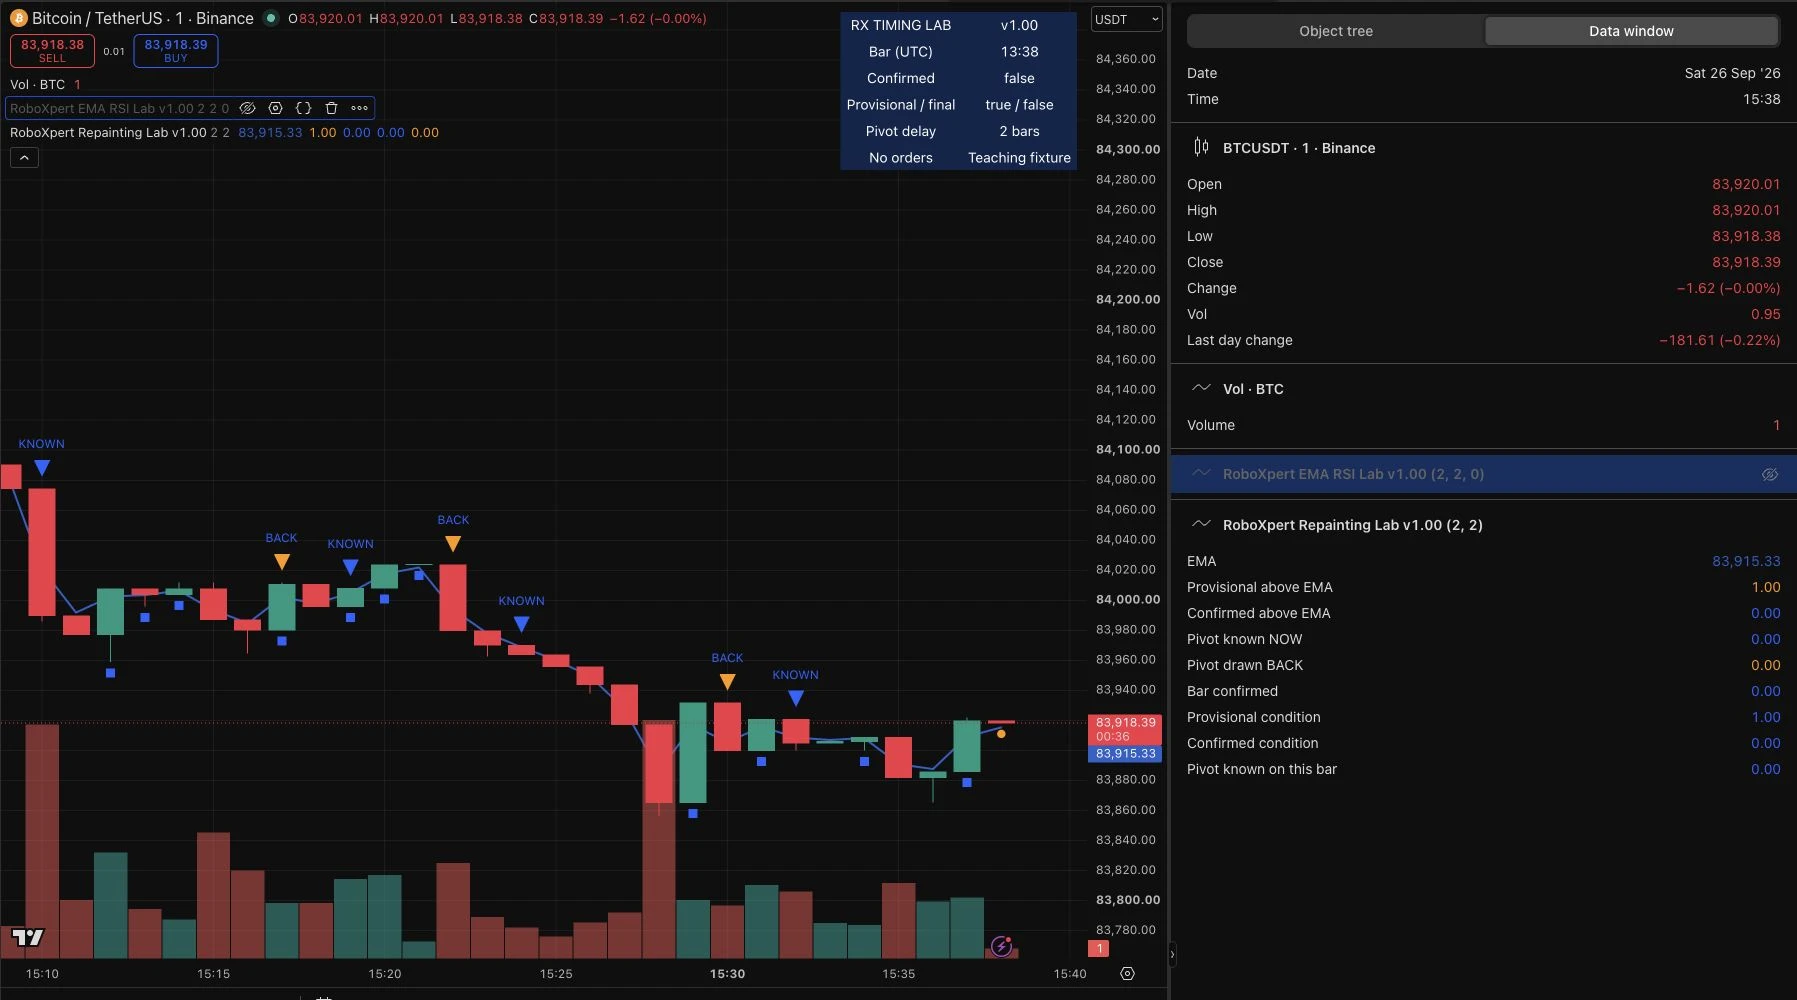
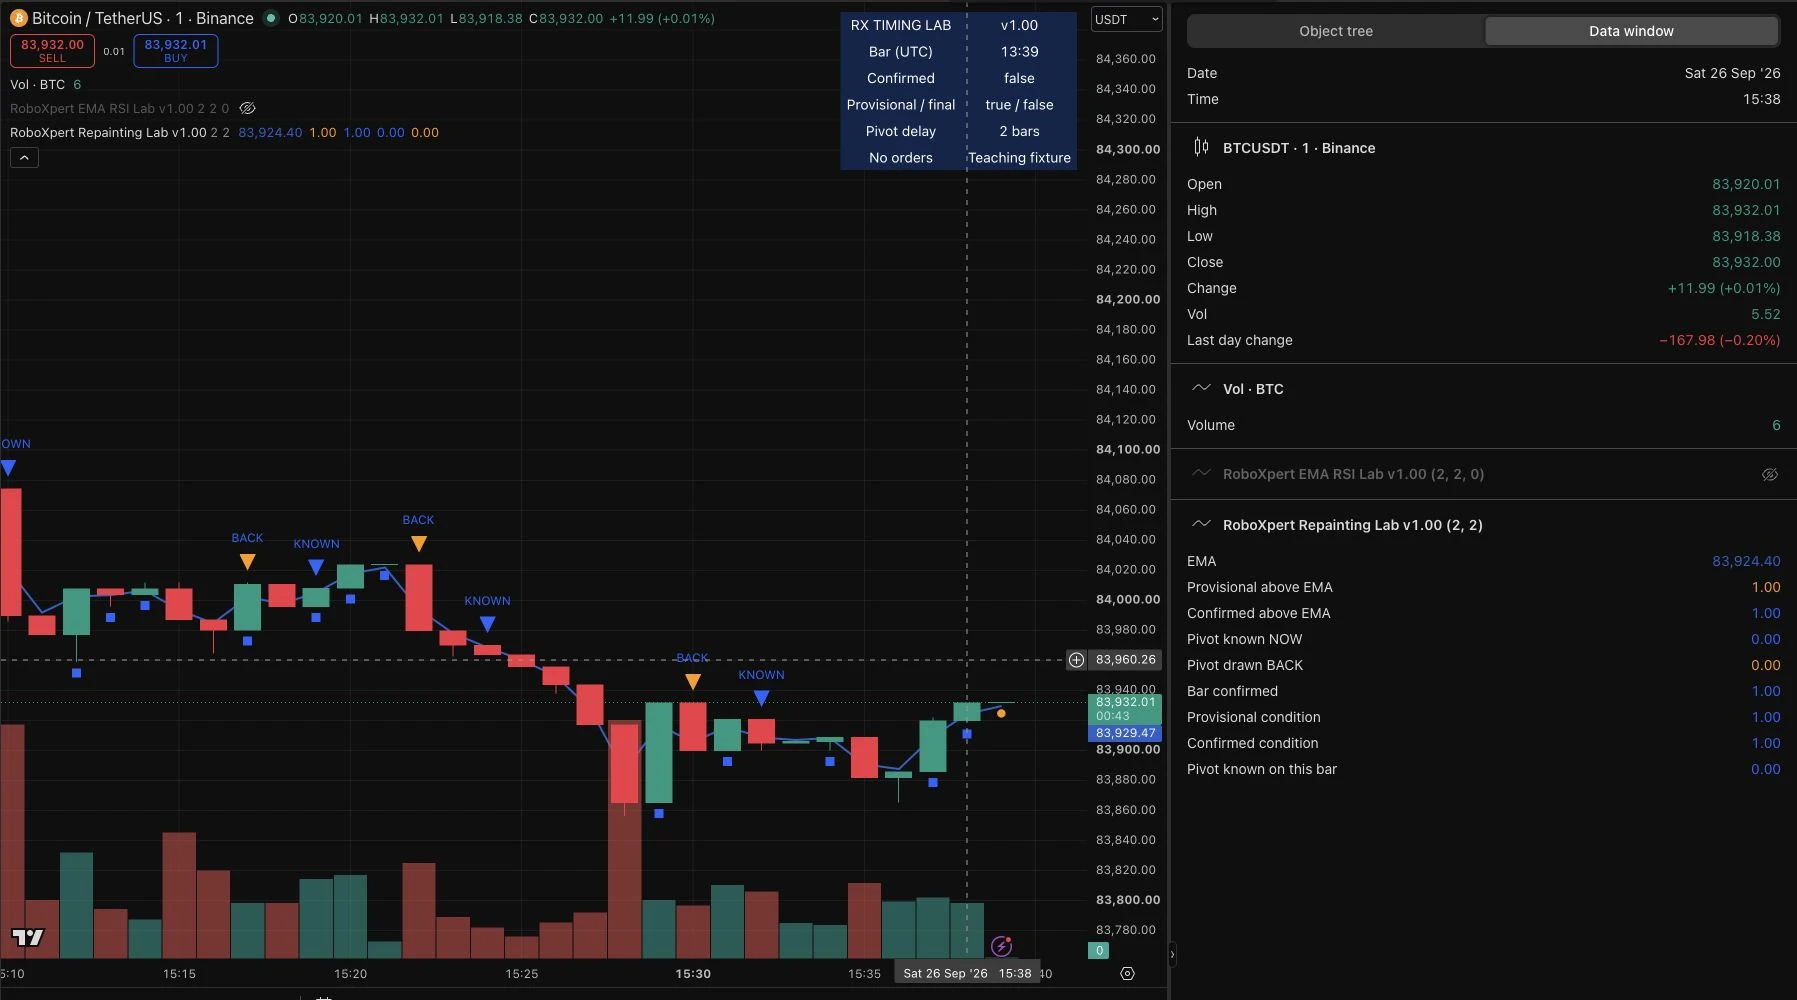
We followed the candle opening at 15:38 UTC+2:
Scroll horizontally if needed
| Observation time, UTC+2 | Candle | Displayed close | Displayed EMA | Bar confirmed | Raw / confirmed condition |
|---|---|---|---|---|---|
| 15:38:14, still open | 15:38 | 83,918.39 | 83,915.33 | 0 | 1 / 0 |
| 15:39:10, after close | 15:38 | 83,932.00 | 83,924.40 | 1 | 1 / 1 |
| 15:41:00, after reload | 15:38 | 83,932.00 | 83,924.40 | 1 | 1 / 1 |
These are visible UI readings rounded as displayed, not downloaded tick data. The screenshot immediately following the first reading can show a later price update within the same open candle; its confirmation and condition states are the comparison of interest.
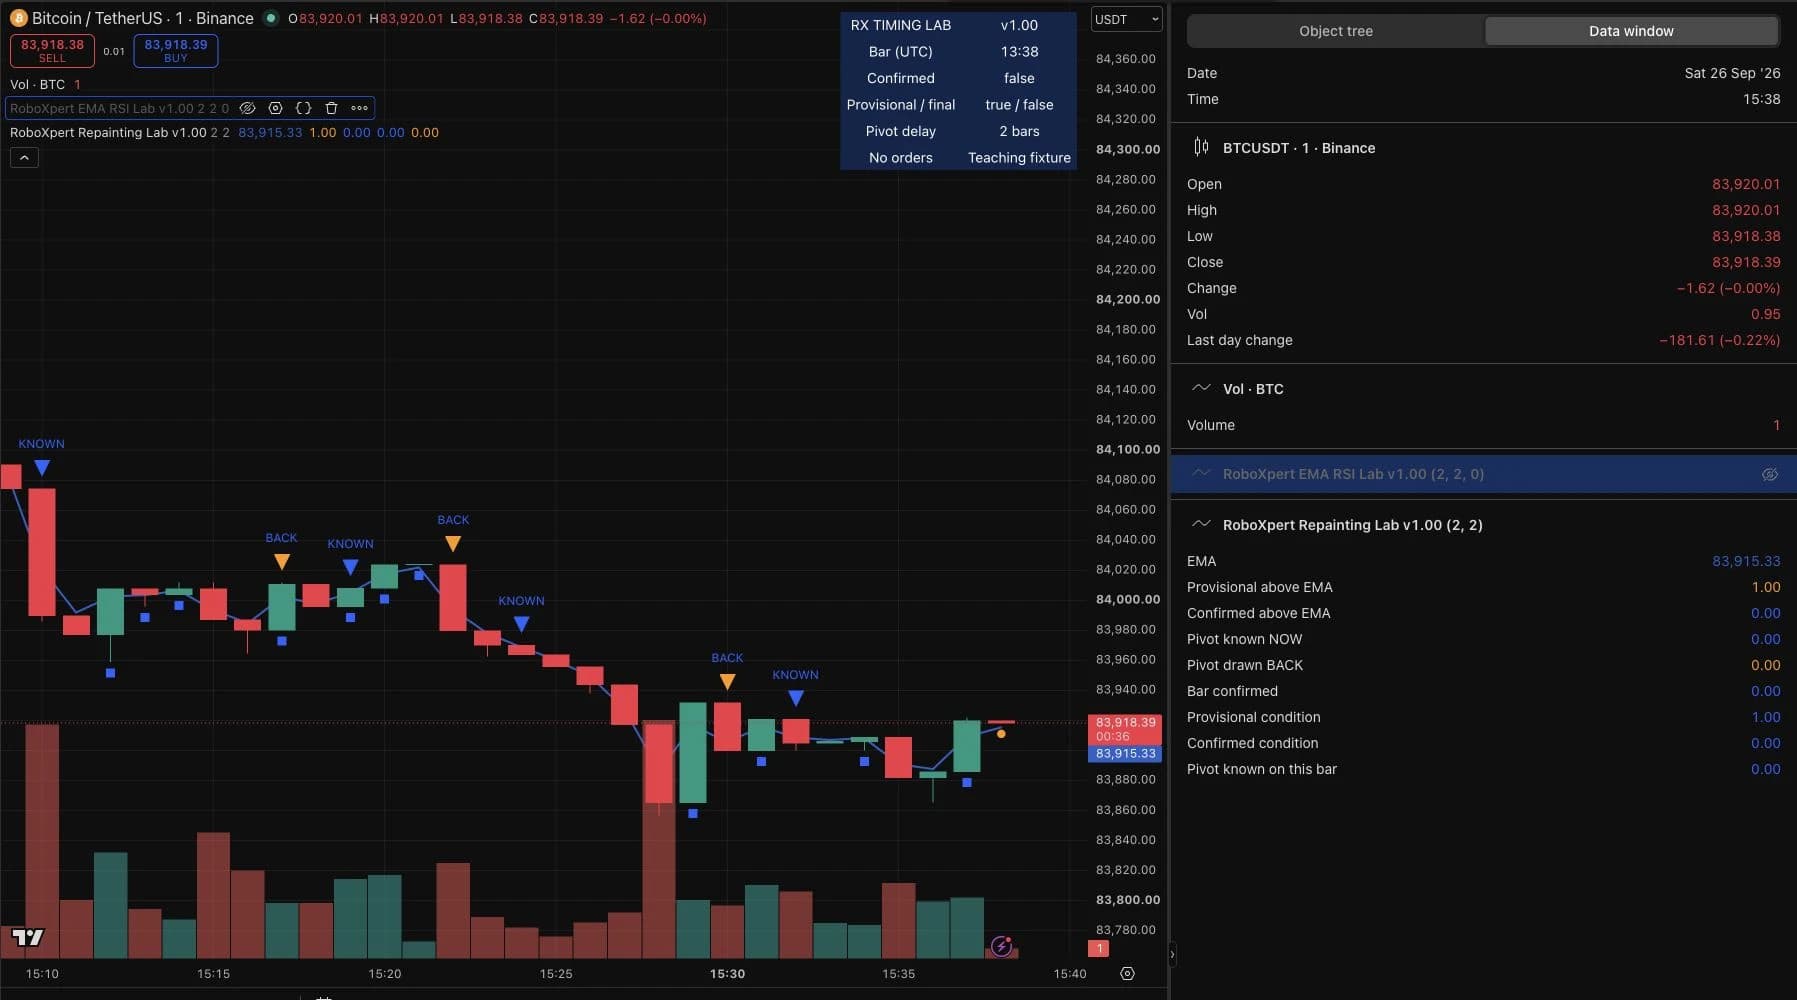
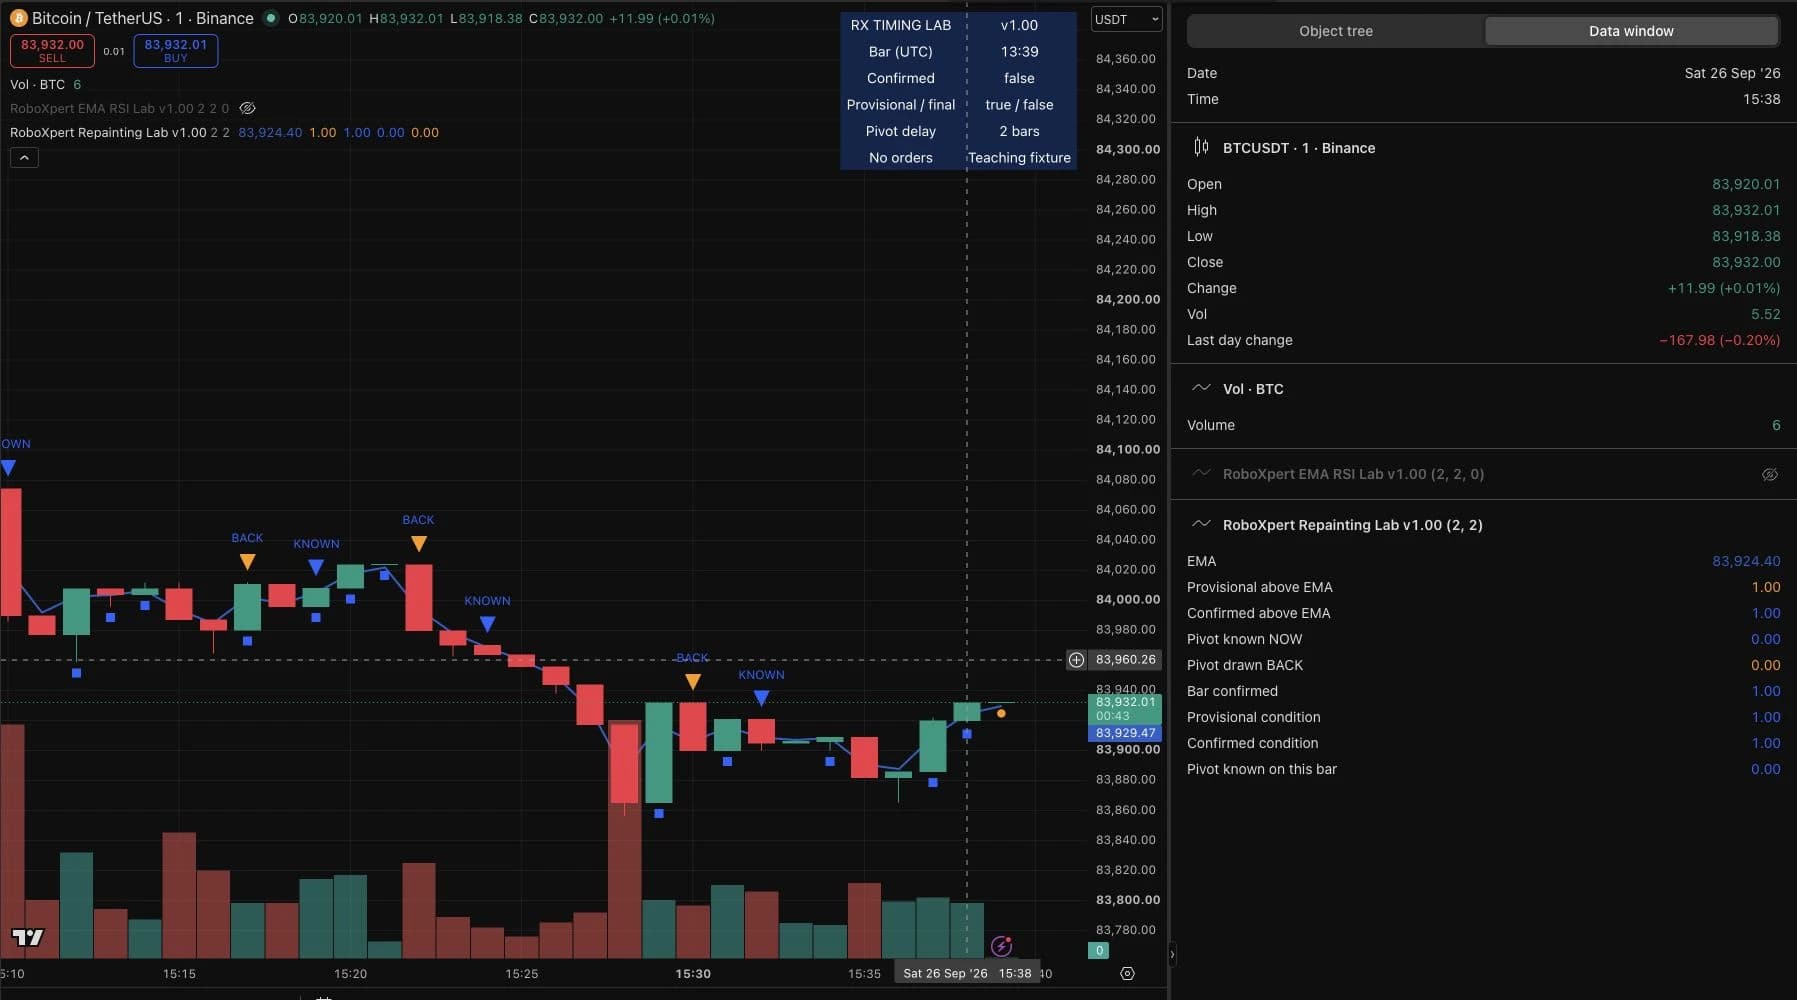
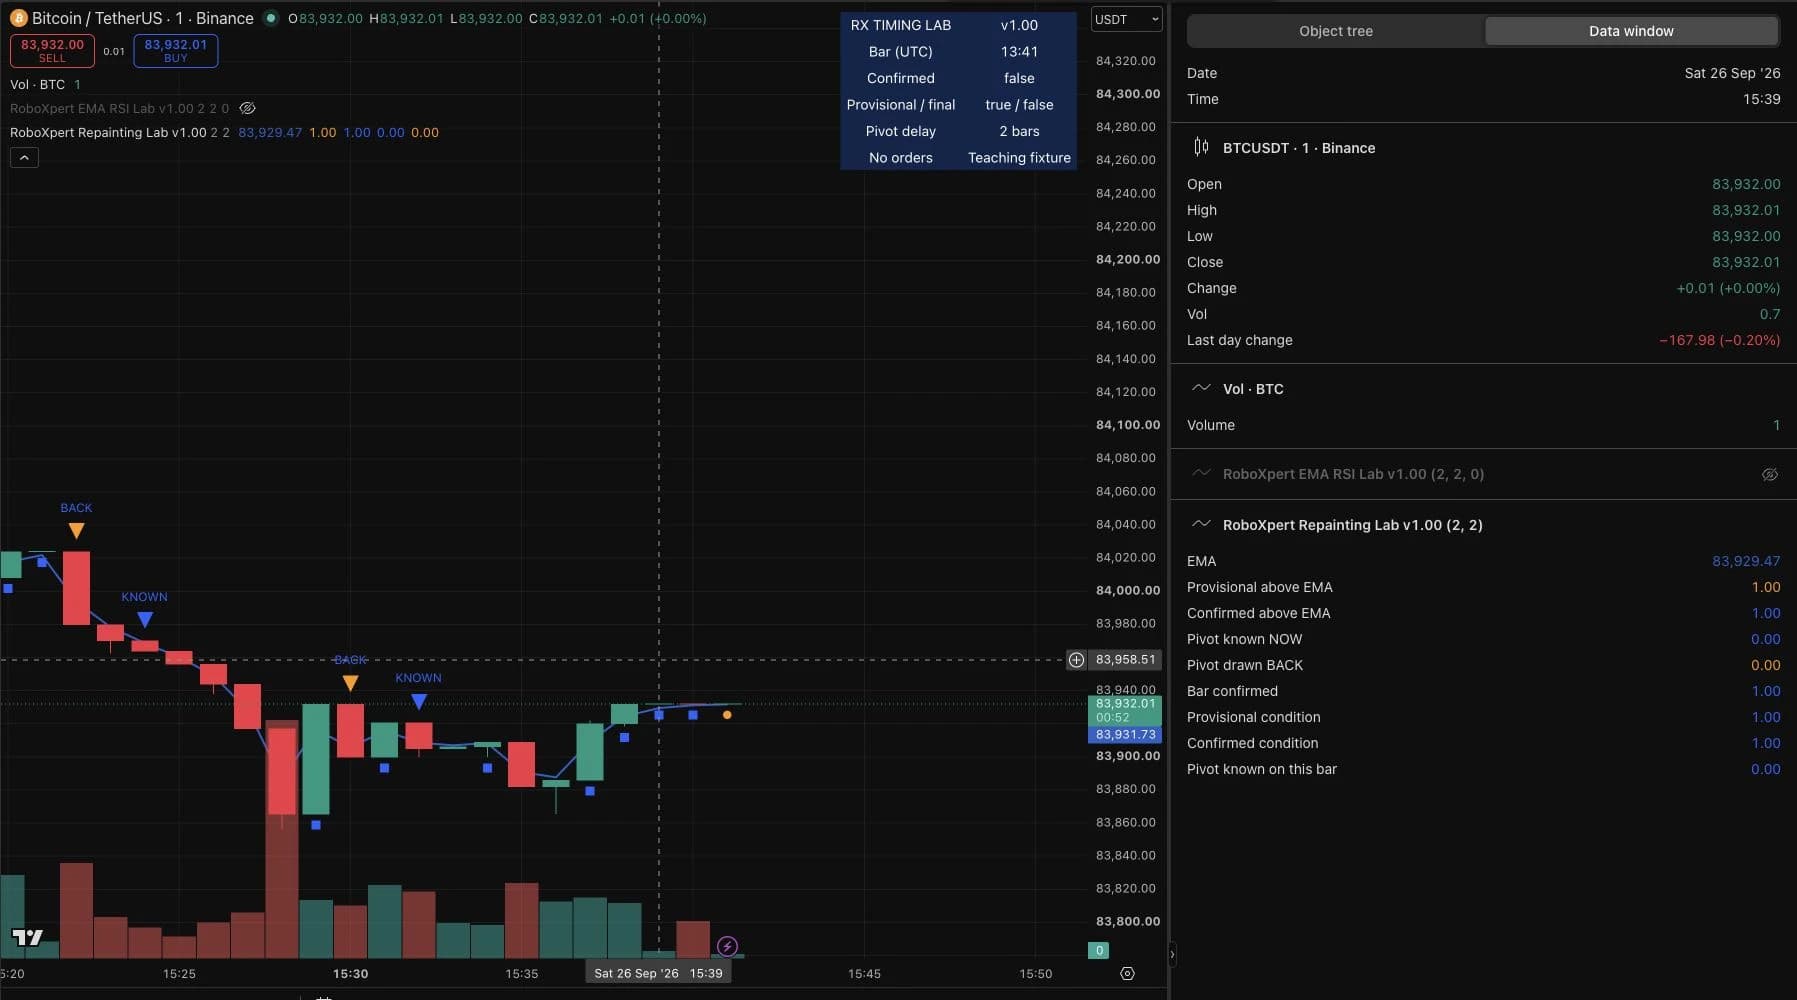
Observed: the raw condition was true while confirmation was false; the confirmed condition became true after close; the selected historical values matched after reload. We did not observe this raw condition disappear before that candle closed. This is a successful observation of confirmation timing and one reload comparison, not evidence covering every future candle or every repainting mechanism.
A pivot can stay fixed and still arrive late
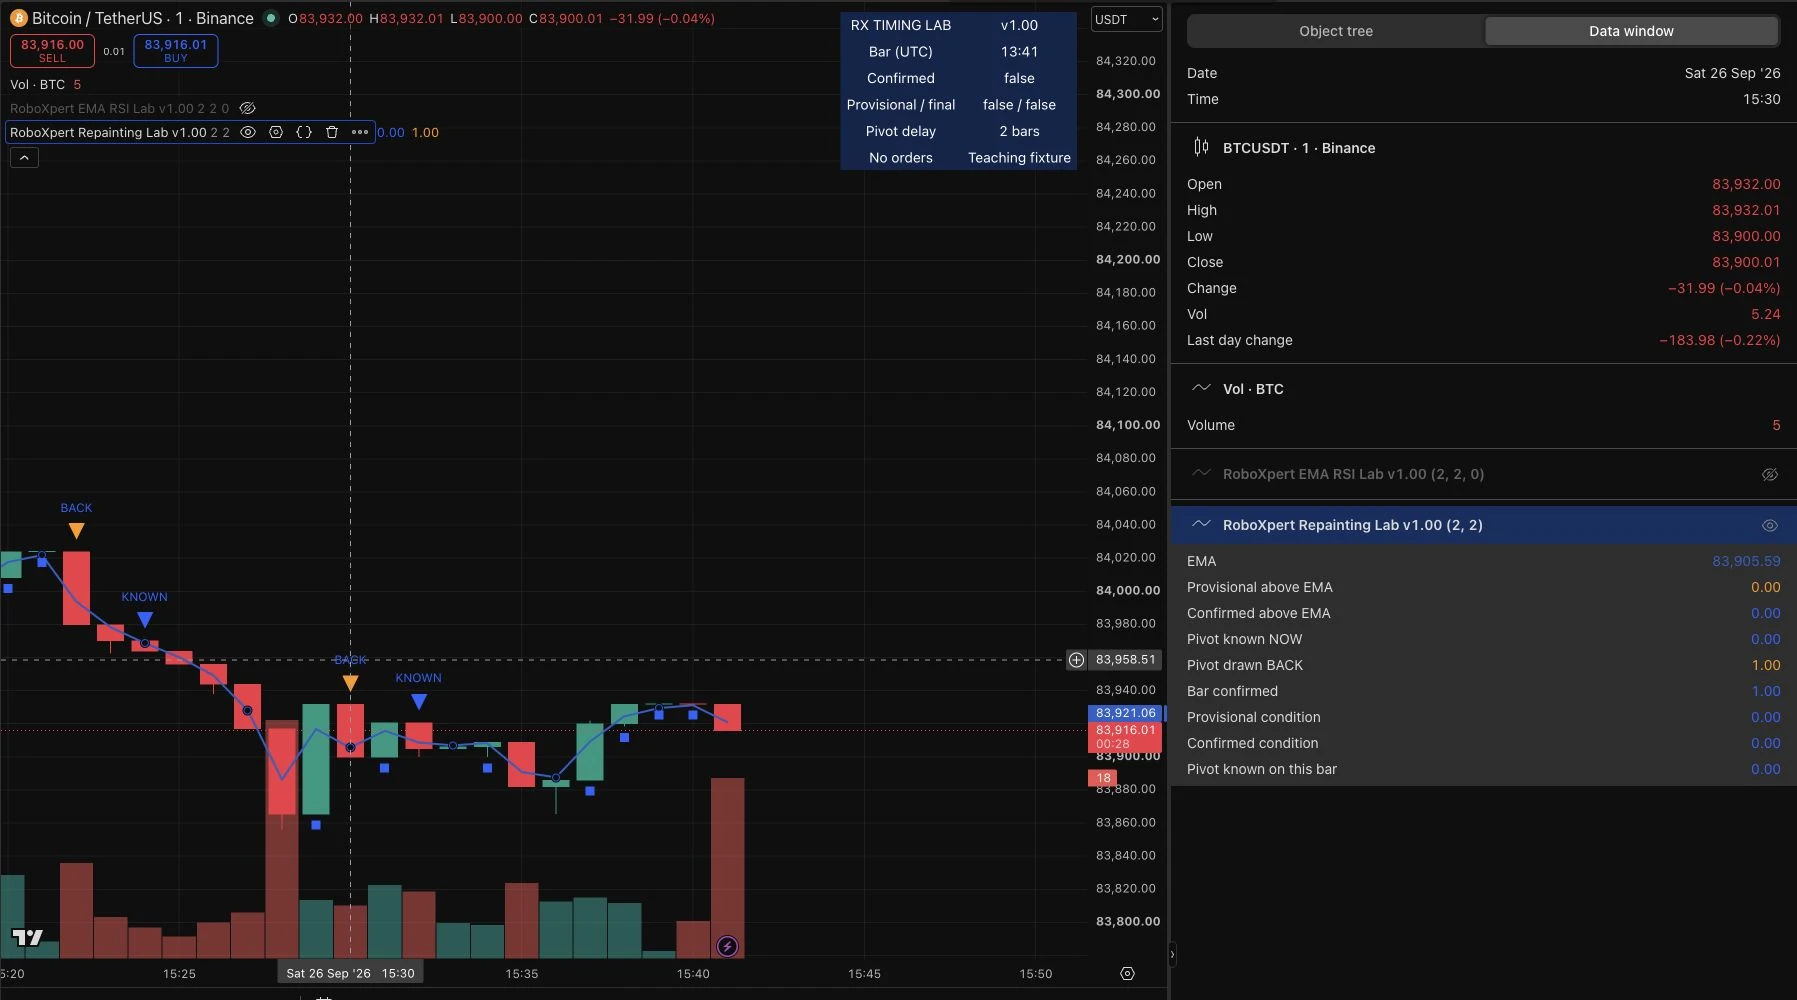
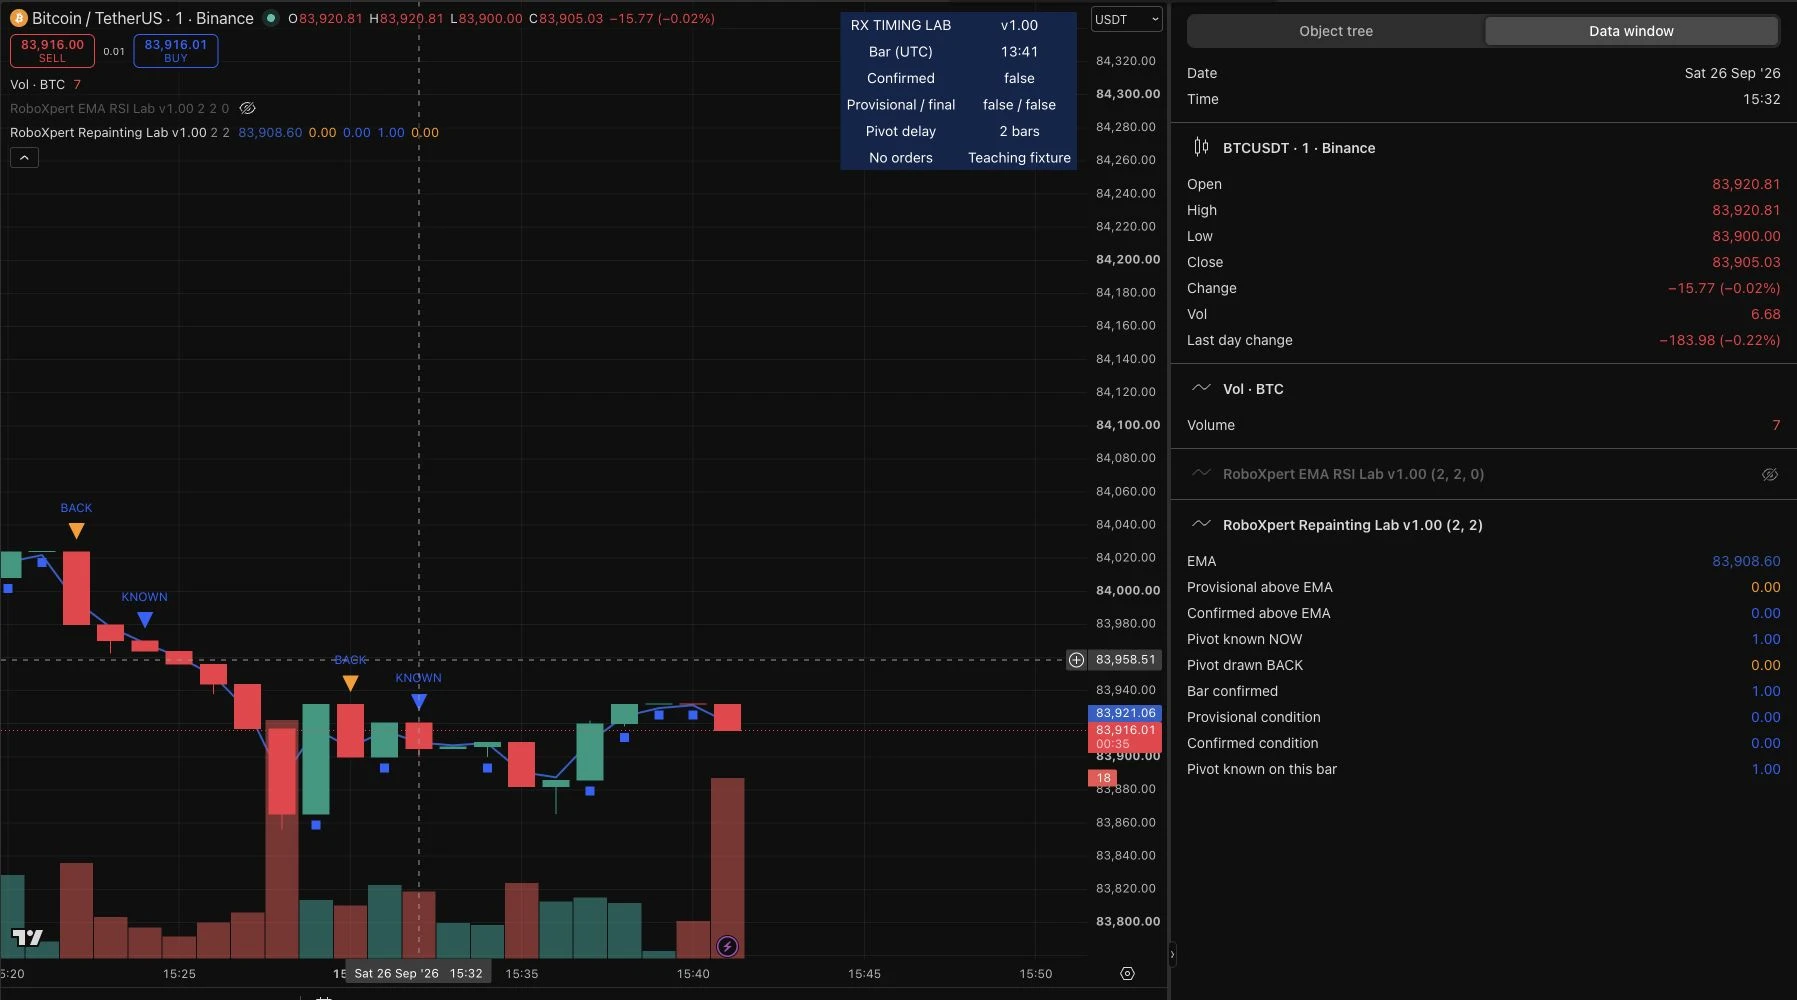
The second part of our script calculates a pivot high using two bars on each side. It draws the same confirmed event twice: a blue KNOWN triangle on the detection bar and an orange BACK triangle two bars earlier.
pivot = ta.pivothigh(high, 2, 2)
pivotKnown = barstate.isconfirmed and not na(pivot)
plotshape(pivotKnown, "Pivot known NOW", shape.triangledown,
     location.abovebar, color.blue, text = "KNOWN")
plotshape(pivotKnown, "Pivot drawn BACK", shape.triangledown,
     location.abovebar, color.orange, offset = -2, text = "BACK")
Our historical inspection after reload found the orange backplotted marker on 15:30, while the unshifted event belonged to 15:32. At 15:30 the Data Window showed Pivot drawn BACK = 1 but Pivot known on this bar = 0. At 15:32 it showed Pivot known on this bar = 1.
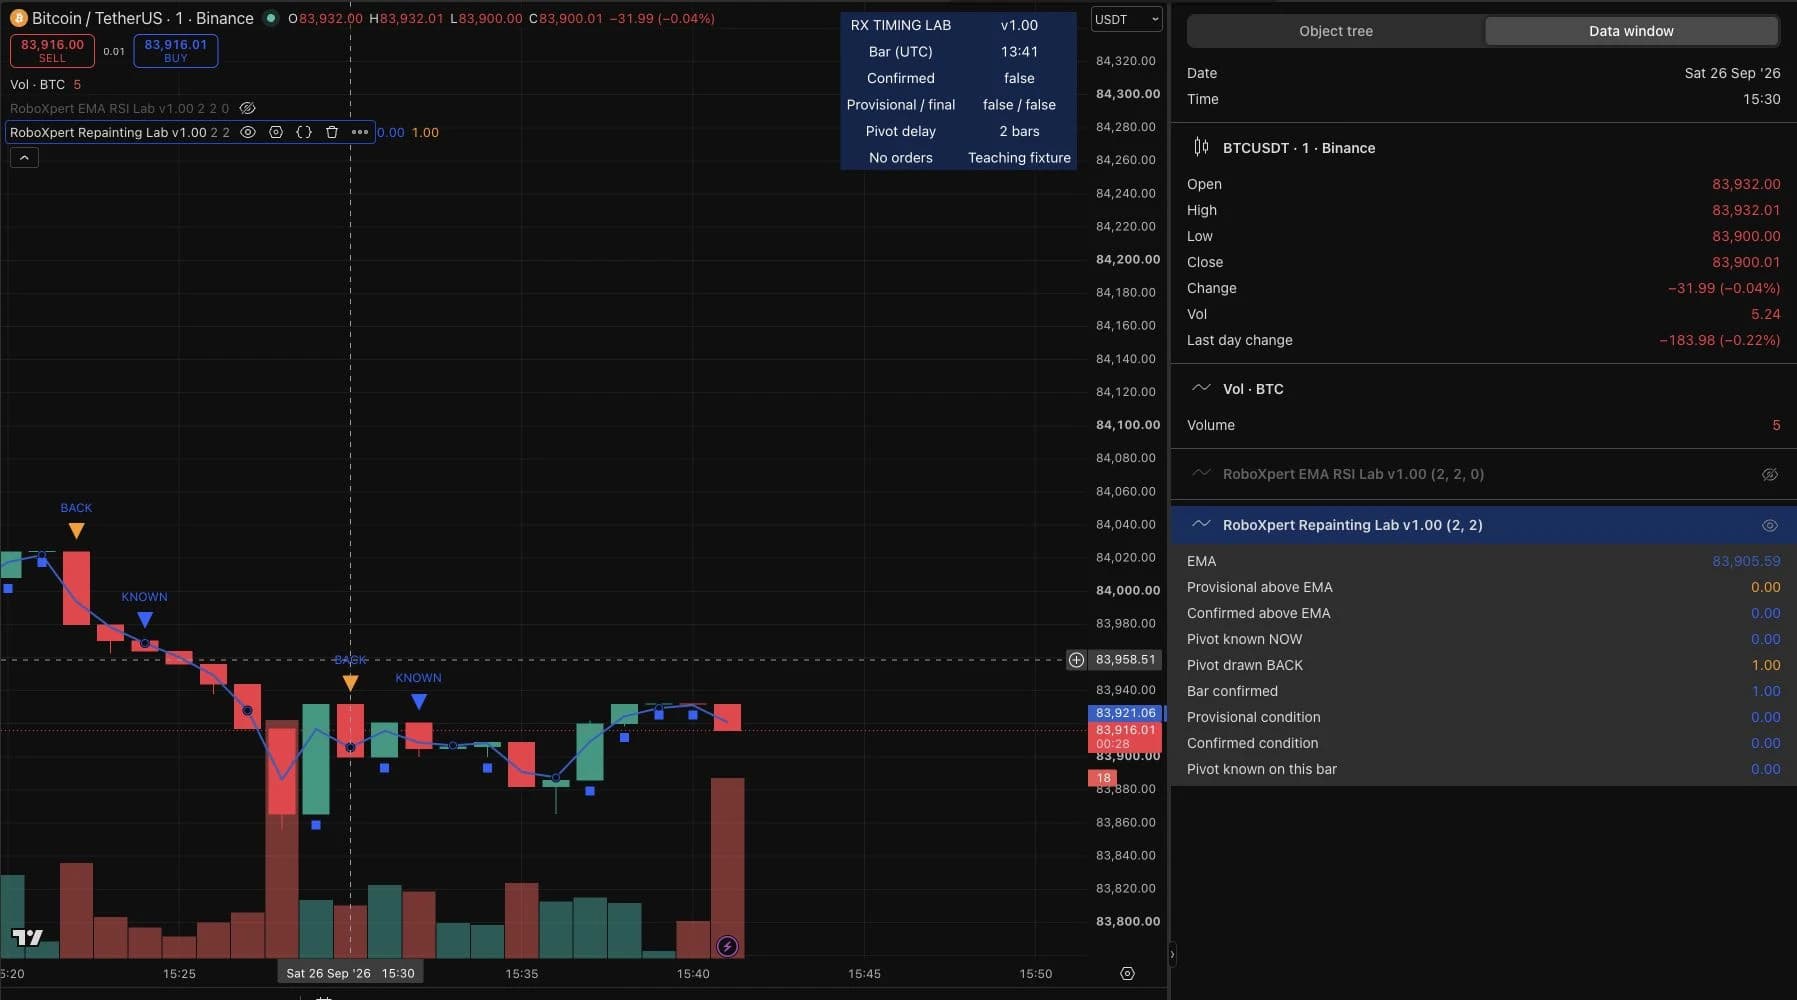
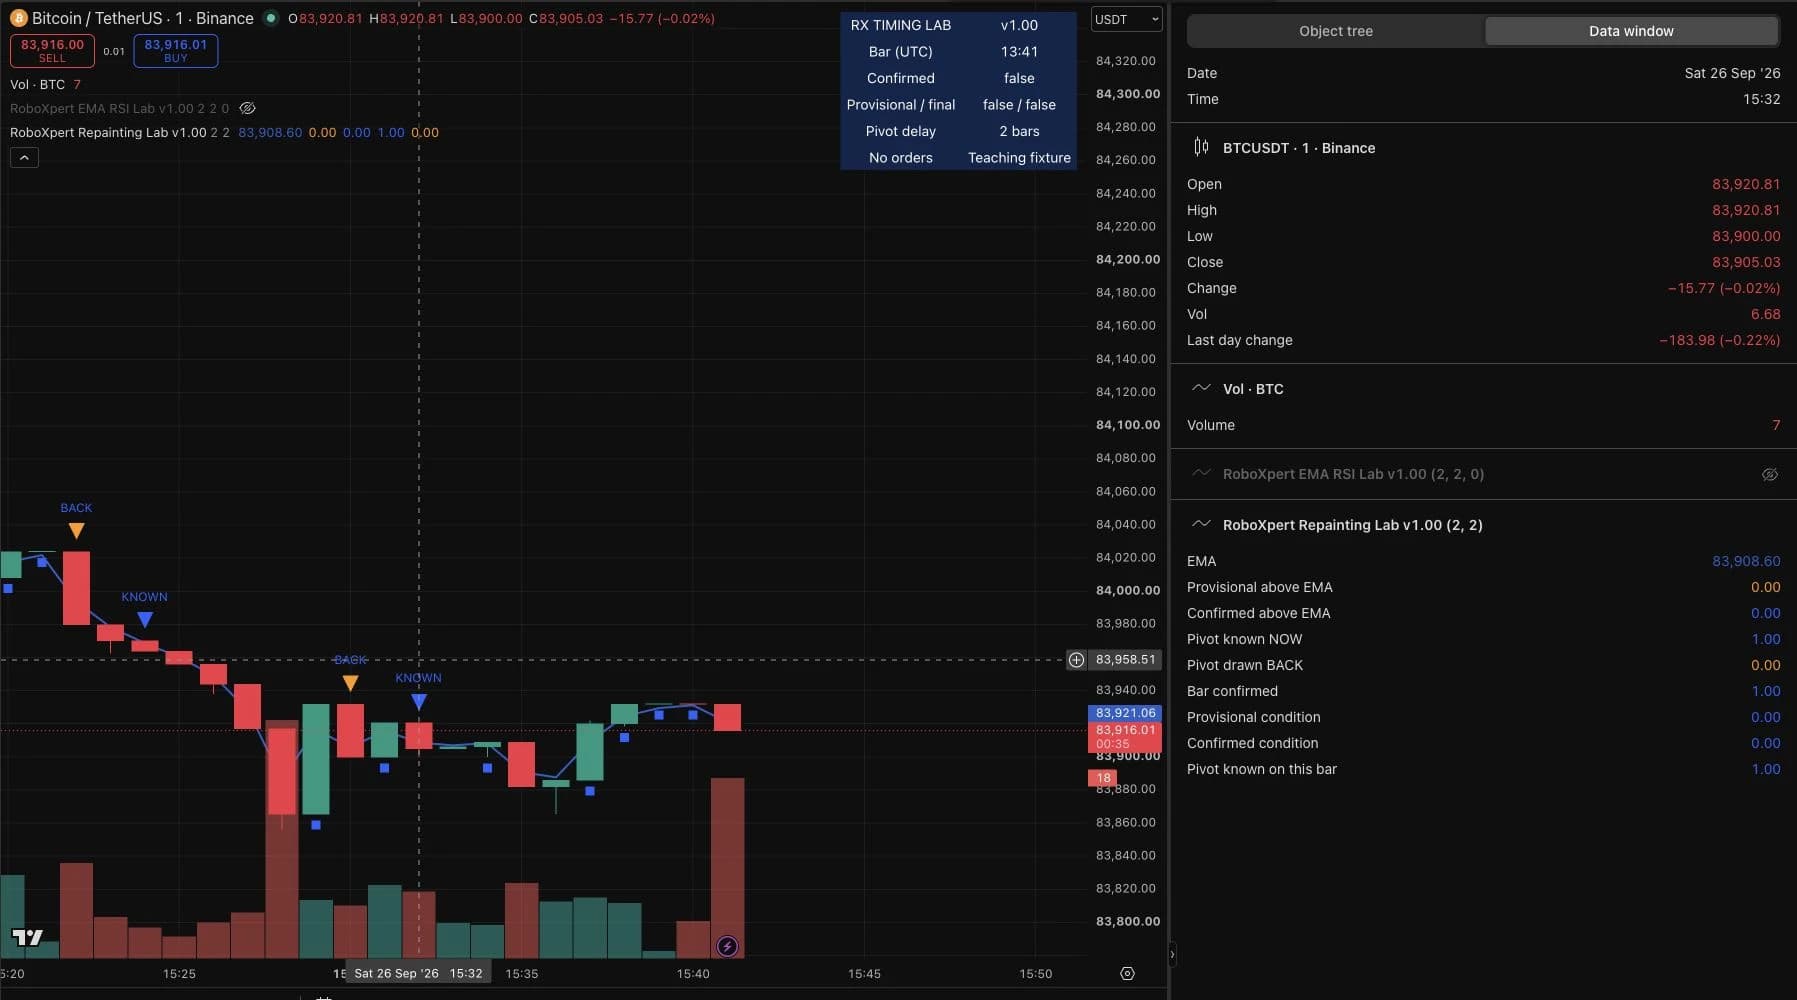
With our source’s confirmation requirement, that 15:32 event belongs to the closing update of the 15:32 candle, not its opening. The orange marker’s position therefore must not be treated as a signal available at 15:30.
This was an inspection of the plotted pair and its source logic, not a live recording of that pivot first appearing. The distinction matters: our captures establish where the two outputs are placed; the code establishes their shared calculation and explicit offset. A delayed pivot can be useful when presented honestly as a later identification of an earlier high.
Use Bar Replay for the question it can answer
Replay can help you advance through historical bars and notice when a marker is added to an earlier candle. Start before the suspected event, step forward one bar at a time, and record the replay cursor separately from the candle receiving the marker.
Do not assume a historical replay reconstructs the complete realtime sequence of price updates inside each candle. Our live observation above and the historical pivot inspection are separate evidence; we did not perform an additional replay experiment for this article.
TradingView also documents that server-side alerts continue to follow realtime data during replay and that new server-side alerts cannot be created in replay mode. A historical replay marker is therefore not proof of a historical alert being delivered. Official Bar Replay limitations.
For alert testing, return to realtime, create an alert with the intended saved settings, observe a qualifying event and inspect its log. Our Pine alert experiment documents an actual log entry and exactly which delivery channels were not tested.
Extra checks when you have Pine source
Trace the inputs of the final signal, not just its last line. These are review targets, not automatic proof of an error:
- Open-bar data: check whether the signal can use changing
close,highorlowbefore confirmation. Pine’s realtime execution and rollback affect what survives from one update to the next. Execution model. - Higher-timeframe requests: a confirmed one-minute chart candle does not necessarily mean a requested hourly value is confirmed. Inspect the requested timeframe, expression, offsets and
lookaheadtogether. For confirmed higher-timeframe values, TradingView documents a previous-bar expression withlookahead_on; removing that offset can introduce future leakage on history. Do not apply the pattern blindly to every request. Other timeframes and data. - Backward placement: inspect negative
plotoffsets and earlier coordinates in drawing calls. Identify when the condition was calculated separately from where it was drawn. - Realtime-only state: review
varip,barstate.isrealtimebranches and other behavior that may not reproduce from historical bars alone.
barstate.isconfirmed is useful for the current chart’s confirmation timing. It is not a blanket fix for higher-timeframe requests, future leakage or backward plotting. Bar-state reference.
When using AI to review source, ask it to trace each signal’s data and timing and propose a falsifiable test. Do not accept “non-repainting” as a substitute for that explanation. Keep proprietary source out of a model service unless you have permission to share it.
Record a bounded conclusion
Reader resource · ZIP
Repainting test code and observation record
Original Pine v6 teaching indicator, dated observations, reproduction instructions and a blank test record. No orders or proprietary indicator code.
Download the repainting labThe package contains the complete teaching indicator, our observation record, reproduction instructions, a blank test sheet and an MIT license. It does not contain our commercial indicator logic or an automated test of another author’s script.
Use one of these conclusions for each behavior:
Scroll horizontally if needed
| Result | Appropriate wording |
|---|---|
| Behavior observed | “The marker was first observed two bars after the candle on which it was drawn.” |
| Behavior not observed in the sample | “These selected closed-bar values matched after reload under the recorded settings.” |
| Not assessable | “The source is unavailable and we did not record the original realtime appearance.” |
Keep an apparent failure reproducible: supply the original and later captures, timestamps, settings and a description of the expected behavior. Keep a passing result narrow enough that another reader can repeat it.
Does non-repainting mean an indicator is profitable?
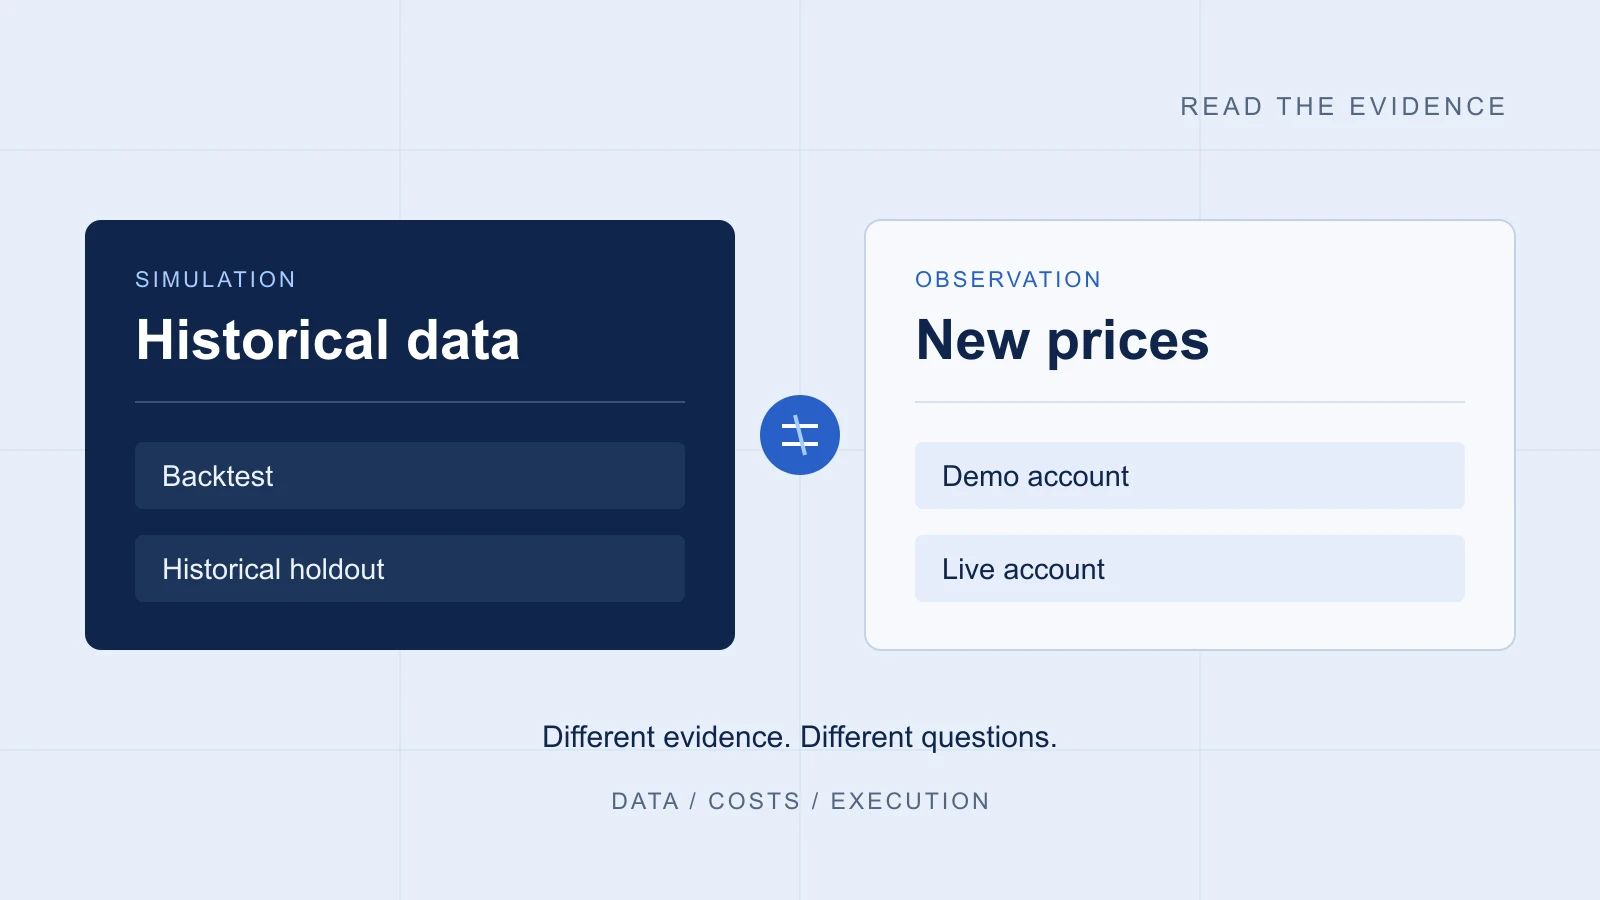
No. Stable signal timing says nothing by itself about transaction costs, exits, position sizing or future returns. An indicator can consistently produce unhelpful signals. See backtest versus live evidence before interpreting chart markers as a trading result.
Can I certify a closed-source indicator with a short test?
You can document a change that occurred, or the absence of a change in the sample you watched. Without its implementation and broader observations, a short test cannot establish how every setting and market condition will behave.
Should I reject every indicator that updates an open candle?
Assess whether the updates match the promised behavior and your intended use. Provisional values can be useful when clearly identified. A claim about confirmed or actionable historical signals needs evidence of when those signals actually became available.

Sources & further reading
Your next question