Learn
Create a TradingView Indicator with AI: Pine Script, Alerts and Checks
At a glance
Describe the indicator’s rule before generating Pine Script. This example plots an EMA and marks confirmed upward price crossings when RSI is above a chosen threshold. We compiled it in TradingView, checked positive and negative cases and compared a historical signal after reload. It does not place trades.
On this page
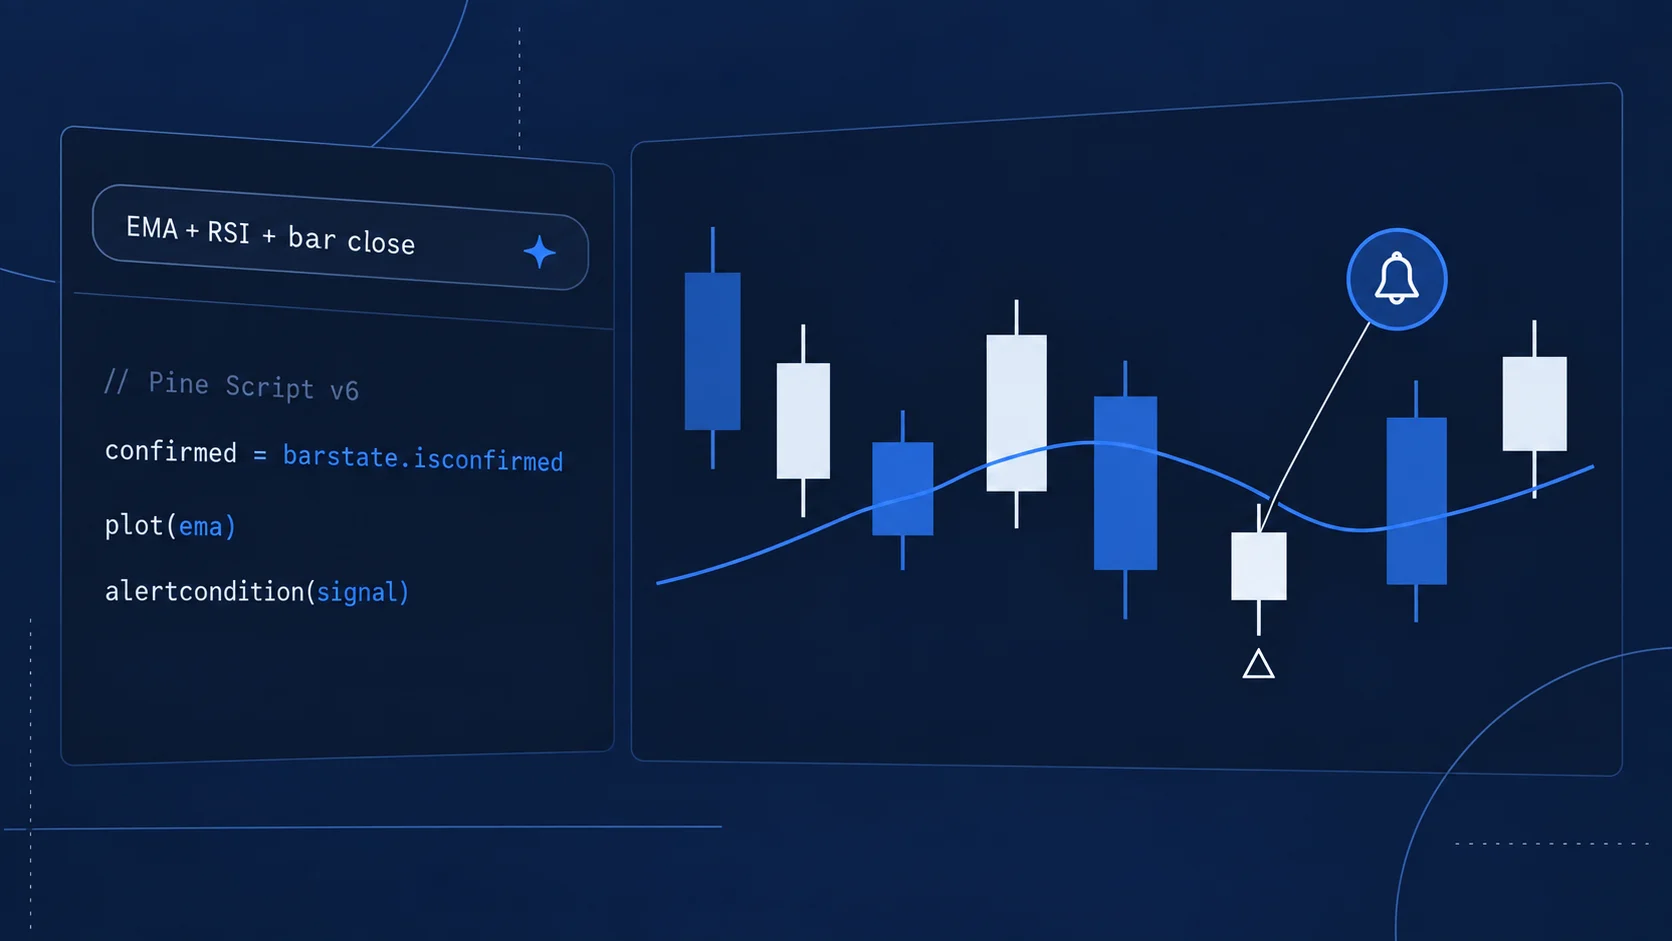
AI can help turn an indicator idea into Pine Script. The harder part is specifying what should appear on the chart, when it should appear and which similar-looking situations should produce no signal.
We will build a small Pine Script v6 indicator: an EMA line and a marker when price crosses above it on a confirmed bar, provided RSI exceeds a threshold. Then we will compare the rule with values from TradingView’s Data Window. The source and our observed checks are downloadable.
This is an original educational example developed with AI assistance. It is not our proprietary 3B Indicator, a strategy backtest or an automated order system. Its default values demonstrate the workflow; they are not recommended trading settings.
Specify the indicator before asking AI for code
“Add a bullish signal with RSI confirmation” is ambiguous. Does the price need to cross the EMA on this bar, or merely be above it? Is equality at the RSI threshold accepted? Can a marker appear before the bar closes?
Our specification answers those questions:
Scroll horizontally if needed
| Part | Rule for this example |
|---|---|
| Data | Standard candles on the chart’s own symbol and timeframe |
| EMA | EMA of closing price, length 20 by default |
| RSI | RSI of closing price, length 14 by default |
| Crossing | Current close above current EMA, previous close at or below previous EMA |
| RSI filter | RSI strictly greater than the chosen threshold, default 50 |
| Timing | Signal requires a confirmed bar |
| Display | Blue EMA line and an RX triangle below qualifying bars |
| Inspection | EMA, RSI, crossing, confirmation and final signal visible in the Data Window |
| Alert event | One named condition using the same final signal as the marker |
| Exclusions | No other timeframes, strategy orders, webhooks or external execution code |
The distinction between crossing and remaining above matters. If price stays above the EMA for five bars, the rule does not ask for five new signals. The additional Data Window fields make that difference inspectable without guessing from pixels.
Use a precise Pine Script prompt
Give the assistant the rule and the current Pine version. You do not need to select a “best trading AI” to begin; you need generated code that can be reviewed and tested.
Write a small original TradingView indicator in Pine Script v6.
Use indicator(), overlay=true, on the chart's current symbol/timeframe.
Plot EMA(close, length), default length 20. Calculate RSI(close, length),
default length 14. Use a configurable RSI threshold, default 50.

Signal only when close crosses above its EMA, RSI is strictly above the
threshold and barstate.isconfirmed is true. Calculate ta.crossover on
every bar before combining the conditions. Plot an RX triangle below
qualifying bars and expose one alertcondition using the identical signal.

Show RSI, crossover, bar confirmation and final signal in the Data Window.
Do not add request.security, offsets into earlier bars, strategy orders,
webhooks, external libraries or additional filters.

Explain what can change on the open bar. Provide a positive case, an RSI
rejection case and a price-above-EMA-without-crossing case. Do not claim
compilation or real-time testing unless those checks were actually run.
Keep the first version small. If the result unexpectedly introduces higher-timeframe data, pivot confirmation or a strategy declaration, review that change before accepting it. Each changes the meaning or timing of the output.
Add the source to TradingView
Open a chart and its Pine Editor, then create a new Indicator. In the interface checked on 26 September 2026, Pine was available from the chart’s right-hand toolbar, and the editor’s script-name menu offered Create new → Indicator. TradingView can change panel placement; the official first-indicator guide is the reference for the editor workflow.
Use a new script and a separate test layout so you can compare changes cleanly. Replace the template with the downloaded source, save it under an identifiable version name and choose Add to chart. Read any compiler errors instead of assuming that a visible editor tab means the script is running.
Here is the complete version used for our checks:
// Original educational example v1.00, 26 September 2026. MIT licence.
//@version=6
indicator("RoboXpert EMA RSI Lab v1.00", overlay = true)
emaLength = input.int(20, "EMA length", minval = 1)
rsiLength = input.int(14, "RSI length", minval = 1)
rsiThreshold = input.float(50, "Minimum RSI (strictly above)", minval = 0, maxval = 100)
emaValue = ta.ema(close, emaLength)
rsiValue = ta.rsi(close, rsiLength)
crossUp = ta.crossover(close, emaValue)
signal = barstate.isconfirmed and crossUp and rsiValue > rsiThreshold
plot(emaValue, "EMA", color = color.rgb(40, 95, 199), linewidth = 2)
plotshape(signal, title = "Confirmed signal", style = shape.triangleup,
     location = location.belowbar, color = color.rgb(40, 95, 199), size = size.small, text = "RX")
plot(rsiValue, "RSI (data window)", display = display.data_window)
plot(crossUp ? 1 : 0, "Cross up (1=yes)", display = display.data_window)
plot(signal ? 1 : 0, "Confirmed signal (1=yes)", display = display.data_window)
plot(barstate.isconfirmed ? 1 : 0, "Bar confirmed (1=yes)", display = display.data_window)
alertcondition(signal, "RX confirmed cross", "RX educational signal: {{ticker}} {{interval}} close={{close}}. Not an order.")
The script compiled and appeared on our chart. That establishes a usable indicator instance, not a trading edge. Our check used BINANCE:BTCUSDT, standard one-minute candles, EMA 20, RSI 14, on 26 September 2026. Chart time was UTC+2. This continuously traded market supplied a Saturday observation window; its selection is not a recommendation to trade it.
Check a positive and a negative case
Open TradingView’s Data Window and select the bar being inspected. Use the fields from the script rather than inferring an exact EMA or RSI value from the drawing.
We inspected the bar opening at 13:13 UTC+2 on 26 September 2026 after it had closed. The displayed values were close 84,183.43, EMA 84,161.82 and RSI 58.64. The crossing, confirmed-bar and final-signal fields all showed 1 with threshold 50. Values below are the rounded interface readings, not a separately reconstructed exchange dataset.
Scroll horizontally if needed
| Check | RSI threshold | Cross up | Bar confirmed | Final signal |
|---|---|---|---|---|
| 13:13 closed bar, original inputs | 50 | 1 | 1 | 1 |
| Same bar, rejection test | 100 | 1 | 1 | 0 |
| 13:14 closed bar, rejection-test inputs | 100 | 0 | 1 | 0 |
| 13:13 after restoring inputs and reloading | 50 | 1 | 1 | 1 |
For the controlled negative test, we changed only the threshold to 100. Because the rule requires RSI to be strictly above it, the marker disappeared even though the crossing was still true. This is deliberately an unreachable filter condition, not a candidate trading configuration.
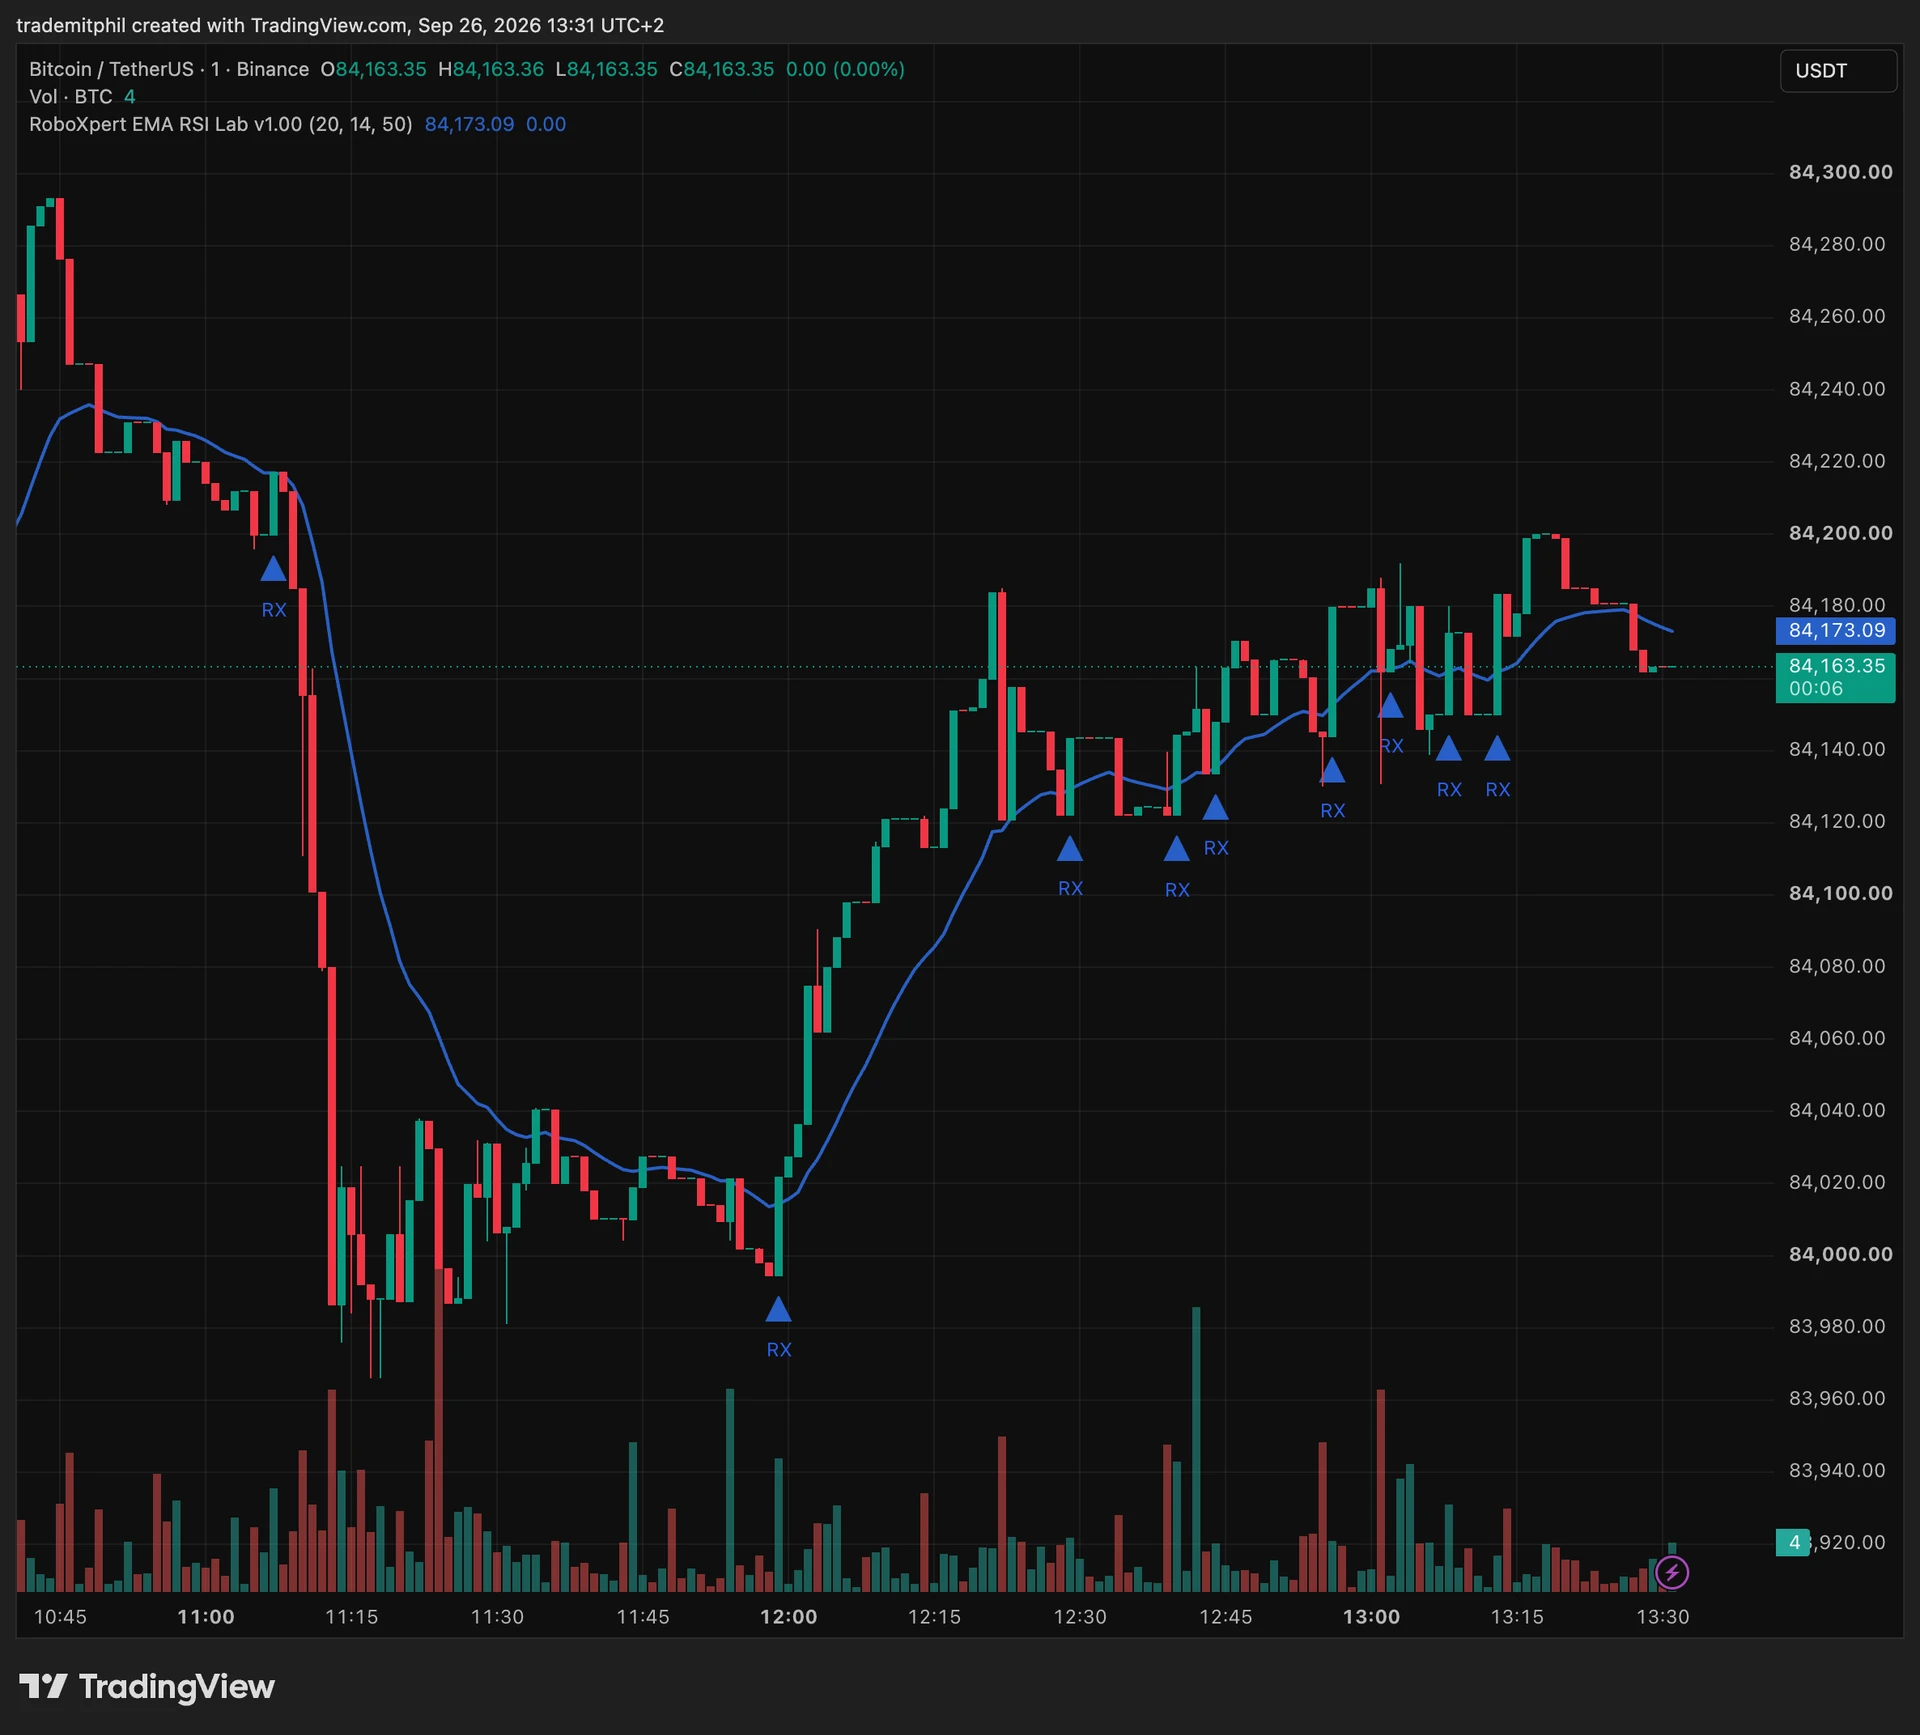
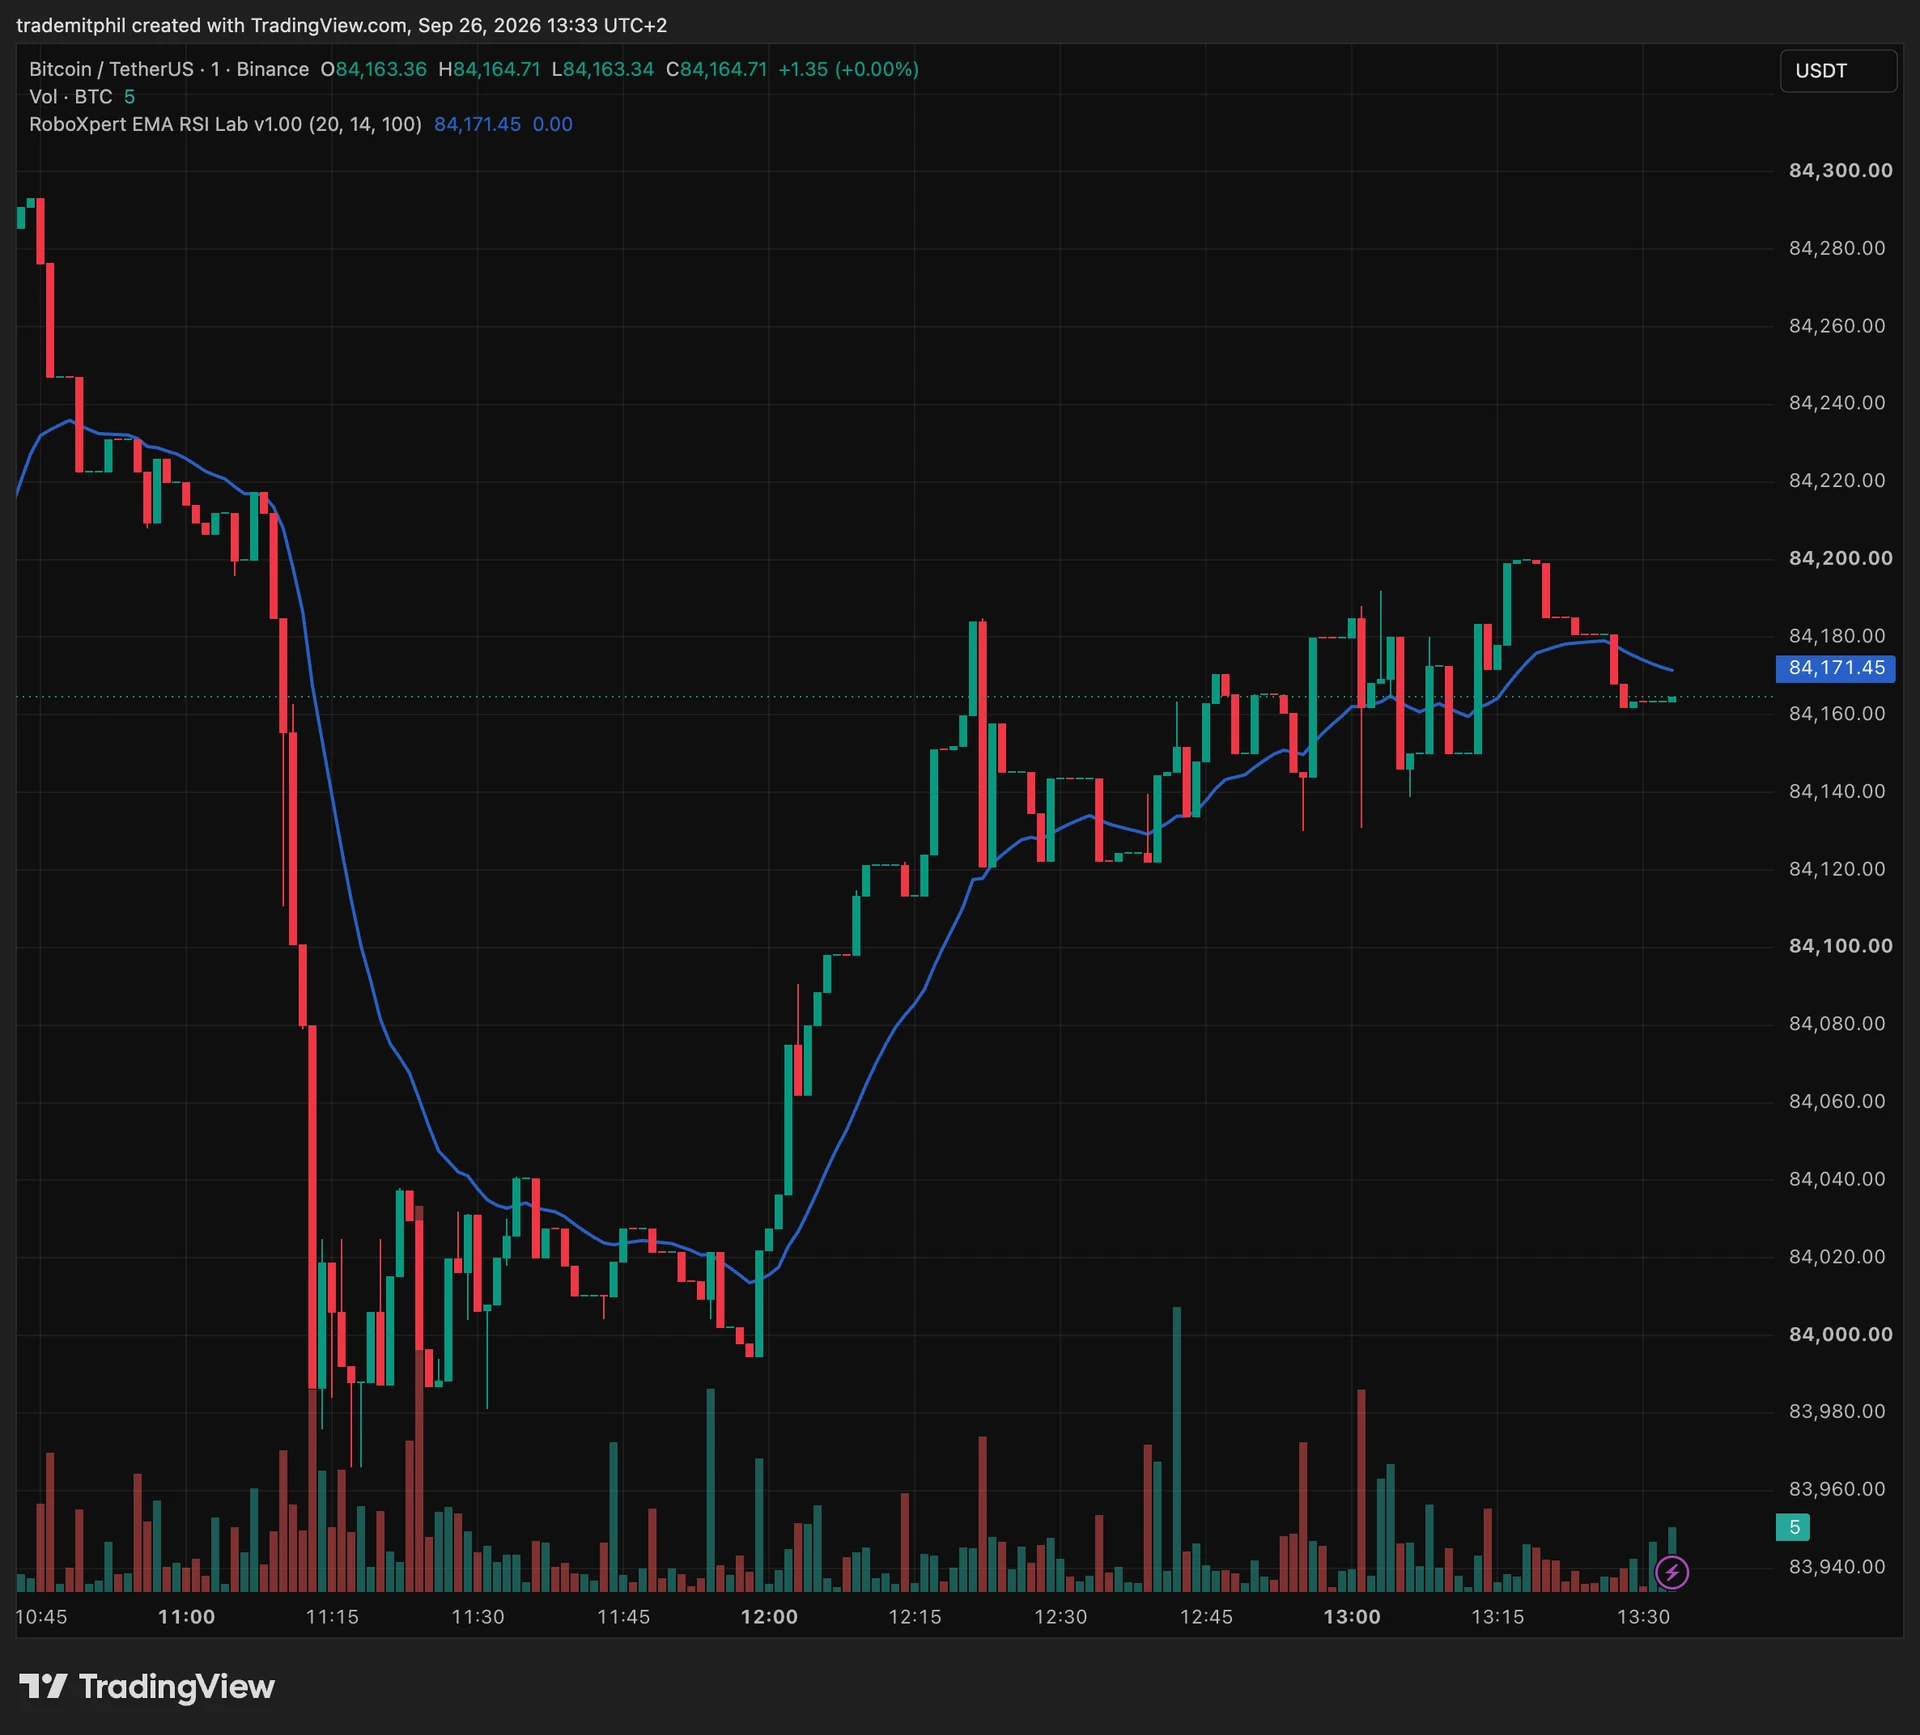
Also check a case where price is above the EMA but did not cross on that bar. At 13:14, the displayed close was 84,171.85, EMA 84,162.78 and RSI 54.06, while Cross up was 0. Being above the line is not itself a new crossing. This observation was taken with threshold 100; it isolates the crossing field rather than claiming another threshold-50 signal test.
Separate the open bar from the closed bar
An indicator recalculates as realtime prices update. In this code, the EMA and RSI can move on the open bar, but the final signal also requires barstate.isconfirmed. TradingView documents that condition as true on historical bars and on the closing update of a realtime bar. Source: bar states.
During our observation at 13:30:53 UTC+2, the current 13:30 bar showed confirmation 0 and signal 0, with RSI 43.72. After it closed, we inspected the same bar at 13:37:03: confirmation was 1, RSI displayed 43.71, and the signal remained 0. This observes a no-signal bar across the boundary; it does not demonstrate a qualifying realtime crossing or delivered alert.
After restoring threshold 50 and reloading the saved layout, the historical 13:13 signal and its displayed EMA/RSI values matched the earlier reading. That is a limited reproducibility check on one historical signal, not proof that the script can never change its historical output under every data or configuration change.
TradingView’s repainting documentation distinguishes several causes of differences between historical and realtime behavior. Confirming the chart bar addresses one timing issue here. It does not justify a universal “non-repainting” guarantee for a later version that adds other timeframes, different data or backward placement of markers.
Configure the alert separately from the indicator
alertcondition() exposes a selectable event. It does not create a running alert by itself. In our dialog check, the indicator appeared as RoboXpert EMA RSI Lab v1.00 (20, 14, 50) and the condition as RX confirmed cross. We selected Same as chart: 1 minute and Once per bar close, inspected the message and then canceled the dialog. No live alert was activated or delivered in this check.
To create your own alert, choose that condition, confirm the interval and bar-close trigger, review the message and notification destination, then create it. Check the resulting alert in the Alerts panel. An old marker on the chart will not retroactively trigger it: alerts operate on realtime events.
TradingView runs a saved snapshot of the script, its inputs, symbol and timeframe for an alert. Changing the chart or code later does not update an existing alert automatically; recreate it when those changes should affect its behavior. Source: TradingView alerts.
Use the same signal variable for the marker and the alert condition, as this example does. Duplicating the logic in two places makes it easier to change one and forget the other. Even shared logic does not prove notification delivery; observe an actual qualifying realtime event and its alert log separately.
An indicator is not an automated trading system
This script declares indicator(). It draws information and exposes an alert event. It has no position sizing, stop loss, exit logic, order submission or account reconciliation.
A Pine strategy() adds simulated trading through TradingView’s broker emulator, which is a different kind of program. It does not by itself automate orders through the connected trading-panel broker. External execution requires additional infrastructure and separate tests of the entire chain. Sources: strategies and automatic trading limitations.
That distinction matters before asking AI to “turn this into a bot.” A marker can match its rule perfectly while the rule has no useful trading advantage. A correct strategy simulation can still omit operational problems outside the emulator. Use our backtest versus live comparison when assessing the next stage of evidence.
Download, reproduce and change one thing
Reader resource · ZIP
Pine Script indicator and check record
Original Pine v6 source, observed chart values, a reproduction checklist and MIT license. A teaching indicator, not a trading strategy.
Download the Pine projectStart by reproducing the default indicator and the threshold-100 rejection test. Record the script version, full symbol including exchange, candle type, timeframe, timezone and inputs. Preserve screenshots and the values you compared.
Then change one behavior, such as the RSI boundary from strictly above to at least the threshold, and add a corresponding equality case. An AI assistant can help write that change; your test should show whether it implements the intended difference.
If you prefer an existing product, our 3B Indicator is separate commercial software developed by the person behind RoboXpert. It is not the source of this downloadable example, and these checks are not a performance test or endorsement of its results.

Sources & further reading
Your next question