Learn
TradingView Indicator vs Strategy: What Can Actually Trade?
At a glance
An indicator calculates and displays information; a strategy adds simulated orders and a performance report. Both can provide alert events, but neither automatically sends Pine orders to a connected brokerage account. Our matched Pine examples show the same confirmed signal on one candle and a simulated market-order fill on the next. Real execution requires a separately configured and checked execution path.
On this page
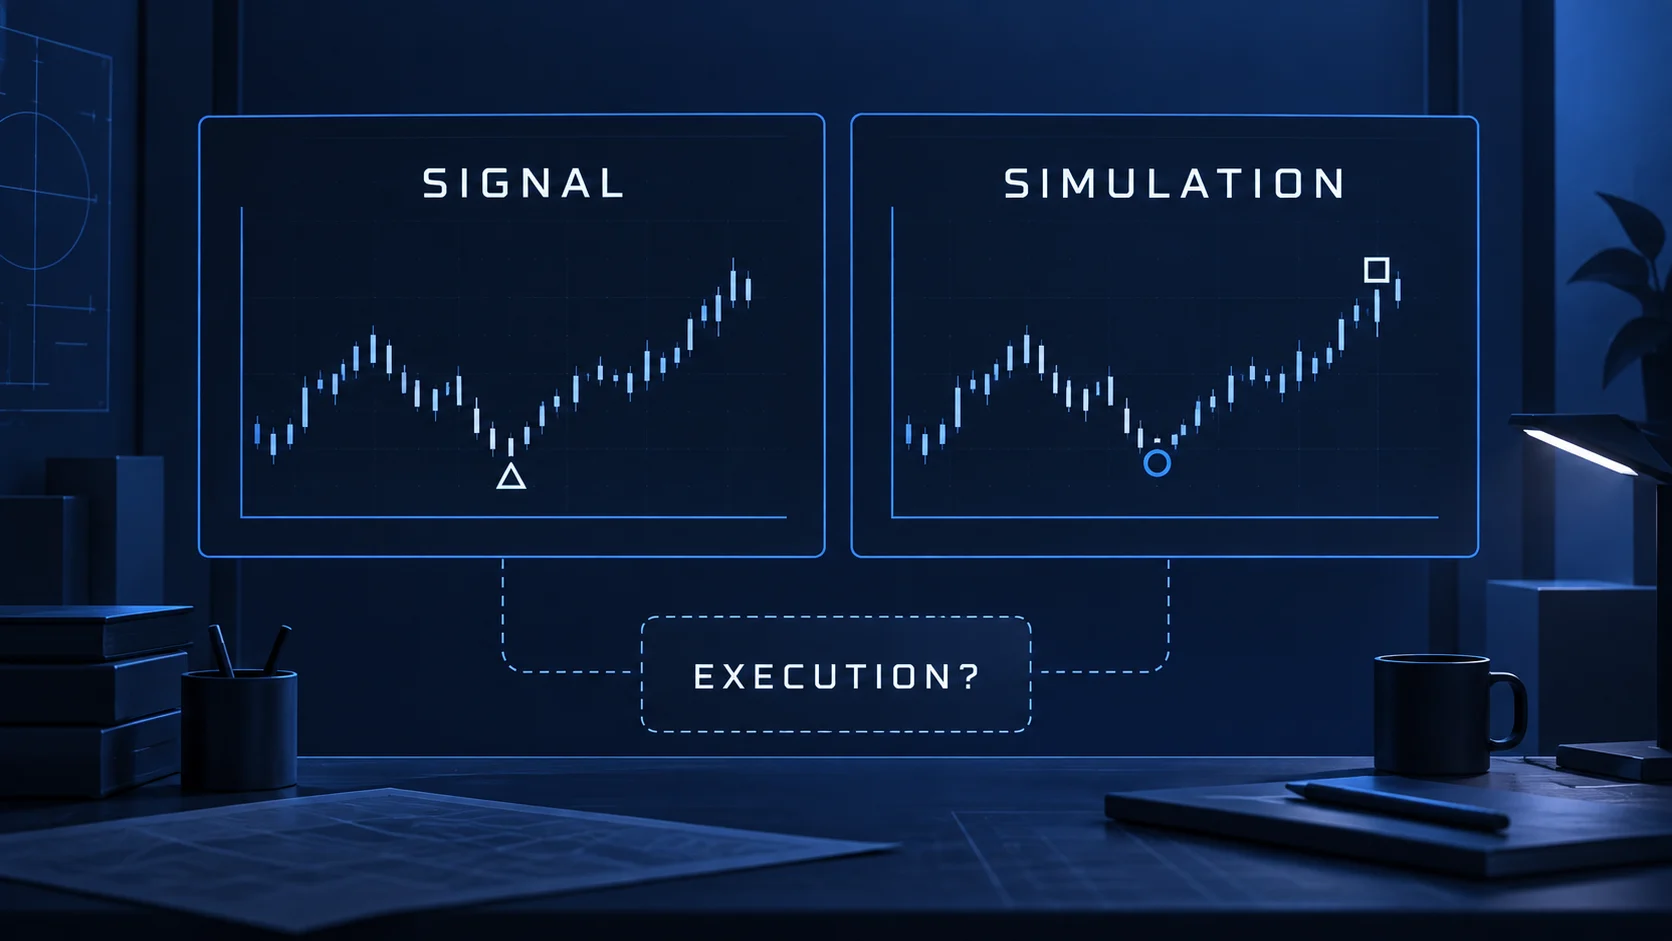
A buy arrow, a strategy report and a filled broker order answer three different questions. The difference between a TradingView indicator and a strategy becomes useful when you ask what you need the software to do: display a condition, test trading rules, or help operate an actual account.
This guide compares those tasks, then uses two original scripts to inspect the same signal in both formats. You do not need to write Pine Script to use the comparison table or follow the chart evidence.
Indicator vs strategy: the practical comparison
Scroll horizontally if needed
| Capability | Indicator | Strategy |
|---|---|---|
| Plot lines, values and signal markers | Yes | Yes |
| Define conditions that can trigger alerts | Yes | Yes, with different alert mechanisms |
| Use TradingView’s built-in simulated orders | No | Yes |
| Produce the built-in strategy performance report | No | Yes, when its simulation produces trades |
| Automatically make a signal profitable | No | No |
| Directly route Pine orders to a connected broker account | No | No |
| Supply events to a separately configured execution service | Possible through suitable alerts | Possible through suitable alerts |
The declaration indicator() or strategy() identifies the script type when source is available. A descriptive name such as “AI Trading Strategy” does not: a seller can use the word strategy for an indicator that only draws signals. TradingView’s community-script guide distinguishes the actual script categories.
An indicator may show its own statistics table. That is a custom calculation, not automatically TradingView’s broker-emulator report. Ask what entry, exit, cost and timing assumptions produced those statistics.
Which one should you use?
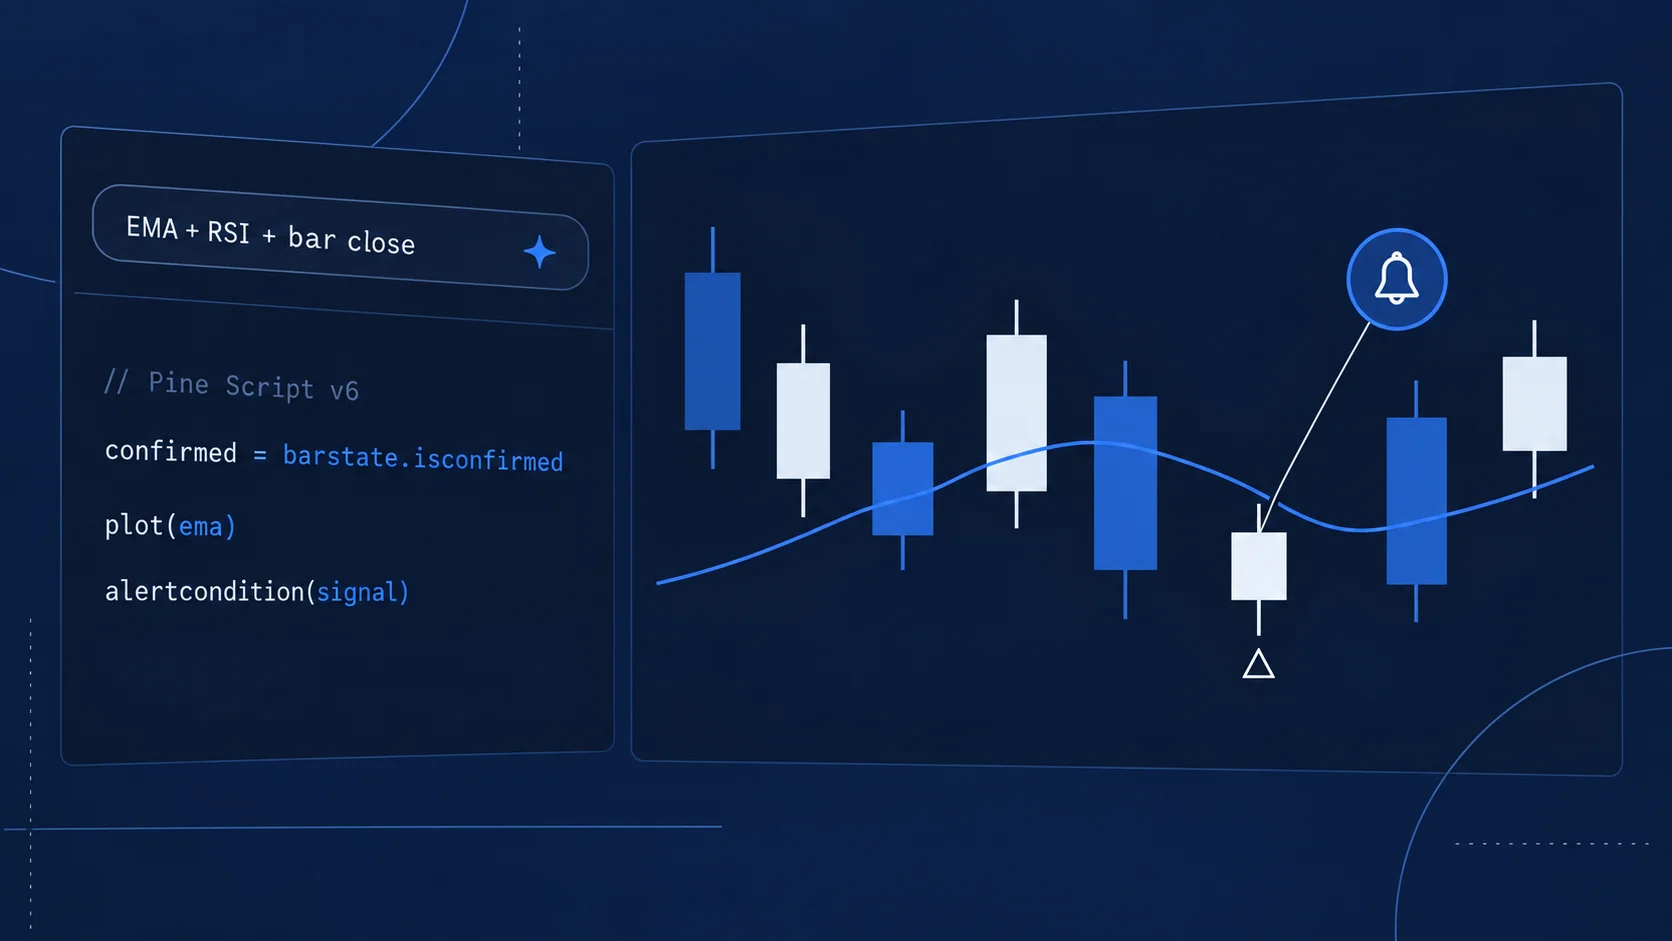
Choose an indicator when your task is to see a moving average, mark a condition, receive a notification or support a decision you make yourself. For example, “tell me when the completed candle first crosses above this average” is a signal specification.
Choose a strategy when you need to simulate a complete set of trading instructions. “Enter after this condition, hold one position, exit on that condition, use this size and charge these costs” defines a testable trading procedure.
Choose an execution integration only after specifying how the system should interact with a real or demo account. That requires a destination, instrument mapping, position sizing, duplicate-event handling and a way to reconcile actual positions. Changing the Pine declaration does not supply those controls.
For a product you already own, first list its documented capabilities. Our own 3B Indicator is described as an indicator; its existence does not imply a separately tested automated execution system. RoboXpert develops trading software, which is a commercial interest relevant to this guide.
Our matched Pine Script experiment
We created RoboXpert Signal Lab v1.00 and RoboXpert Simulation Lab v1.00 with AI assistance. Both compiled and ran on TradingView on 27 September 2026 in a separate laboratory layout. We inspected BINANCE:BTCUSDT, standard one-minute candles, chart timezone UTC+2, SMA length 5.
Both files calculate the same condition:
basis = ta.sma(close, length)
crossUp = ta.crossover(close, basis)
crossDown = ta.crossunder(close, basis)
enter = barstate.isconfirmed and crossUp
leave = barstate.isconfirmed and crossDown
The indicator plots a blue SIGNAL triangle and an orange EXIT triangle. Those labels describe conditions, not completed transactions. It also exposes the conditions as 0 or 1 in the Data Window.
The strategy preserves those plots and adds this long-only simulation:
if enter and strategy.position_size == 0
    strategy.entry("Demo long", strategy.long)
if leave and strategy.position_size > 0
    strategy.close("Demo long")
Its settings deliberately make the experiment inspectable:
Scroll horizontally if needed
| Setting | Value used in our teaching script |
|---|---|
| Initial simulated capital | 100,000 |
| Fixed order quantity | 0.01 units for the selected symbol |
| Pyramiding | 0; no additional same-direction entries |
| Commission | 0.1% of transaction value per filled order |
| Slippage | 1 minimum price tick |
| Recalculate on every tick / after fills | Both false |
| Process orders on the closing tick | False |
| Exit | Confirmed downward cross, while a long is open |
These are illustrative test settings, not measured Binance fees or recommended trading parameters. Quantity units depend on the instrument. The example has no protective stop or deployment controls and is not a system to connect to a trading account.
What we observed on the selected candles
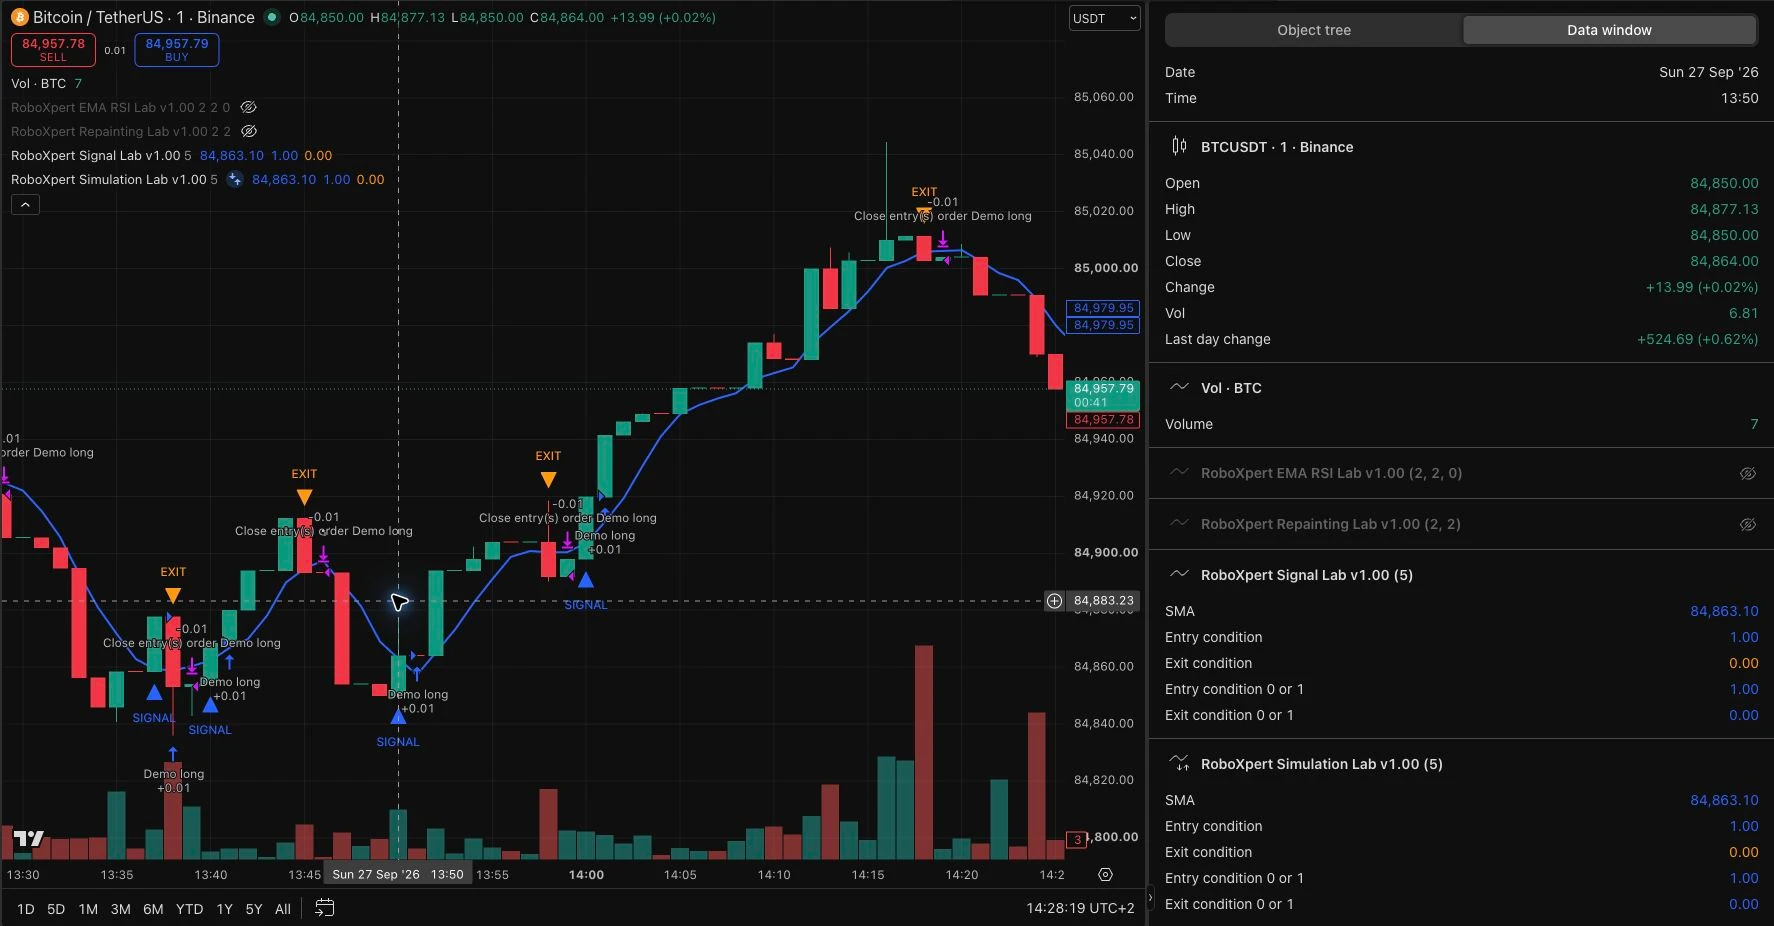
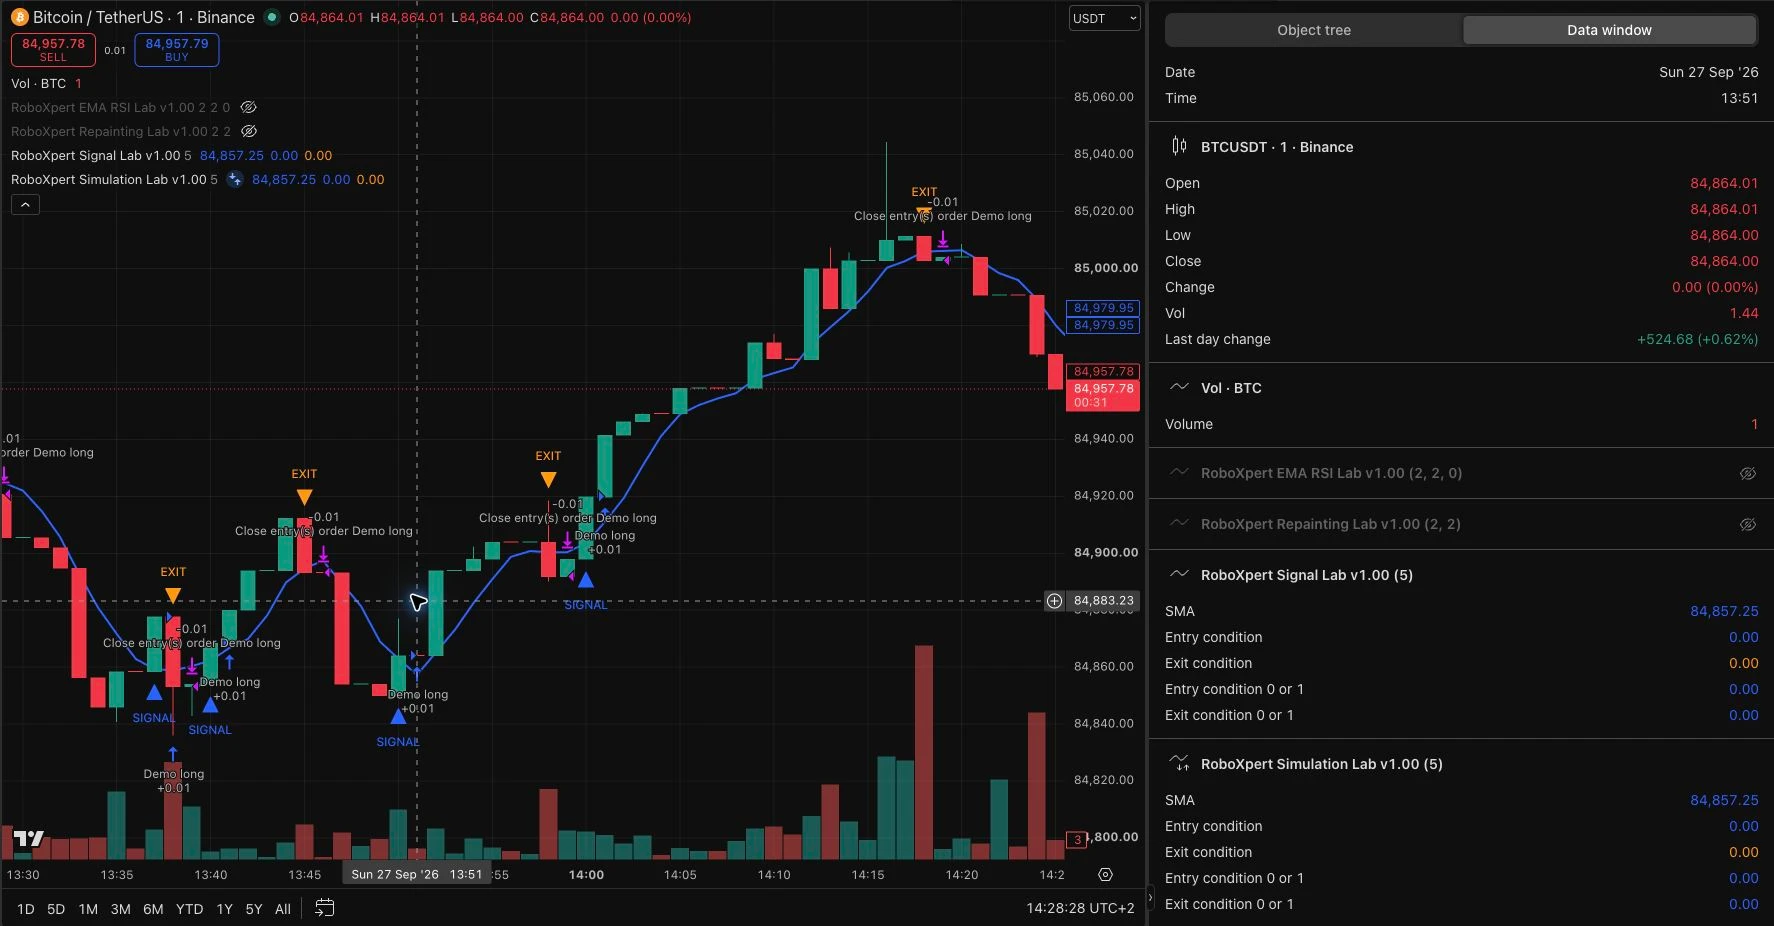
At approximately 14:28 UTC+2, we inspected two already closed candles. These are historical chart observations, not a recording of the original realtime signal arrival.
Scroll horizontally if needed
| Candle opening time, 27 September 2026, UTC+2 | Close | SMA in both scripts | Entry condition in both scripts | Strategy chart |
|---|---|---|---|---|
| 13:50 | 84,864.00 | 84,863.10 | 1 | Signal triangle |
| 13:51 | 84,864.00 | 84,857.25 | 0 | Demo long simulated entry marker |
The Data Window values matched between the indicator and strategy on both selected closed bars. The strategy’s entry marker appeared one bar after the signal. The 13:51 bar opened at 84,864.01; the example also applies its configured slippage. We did not use this inspection to establish a broker fill price.
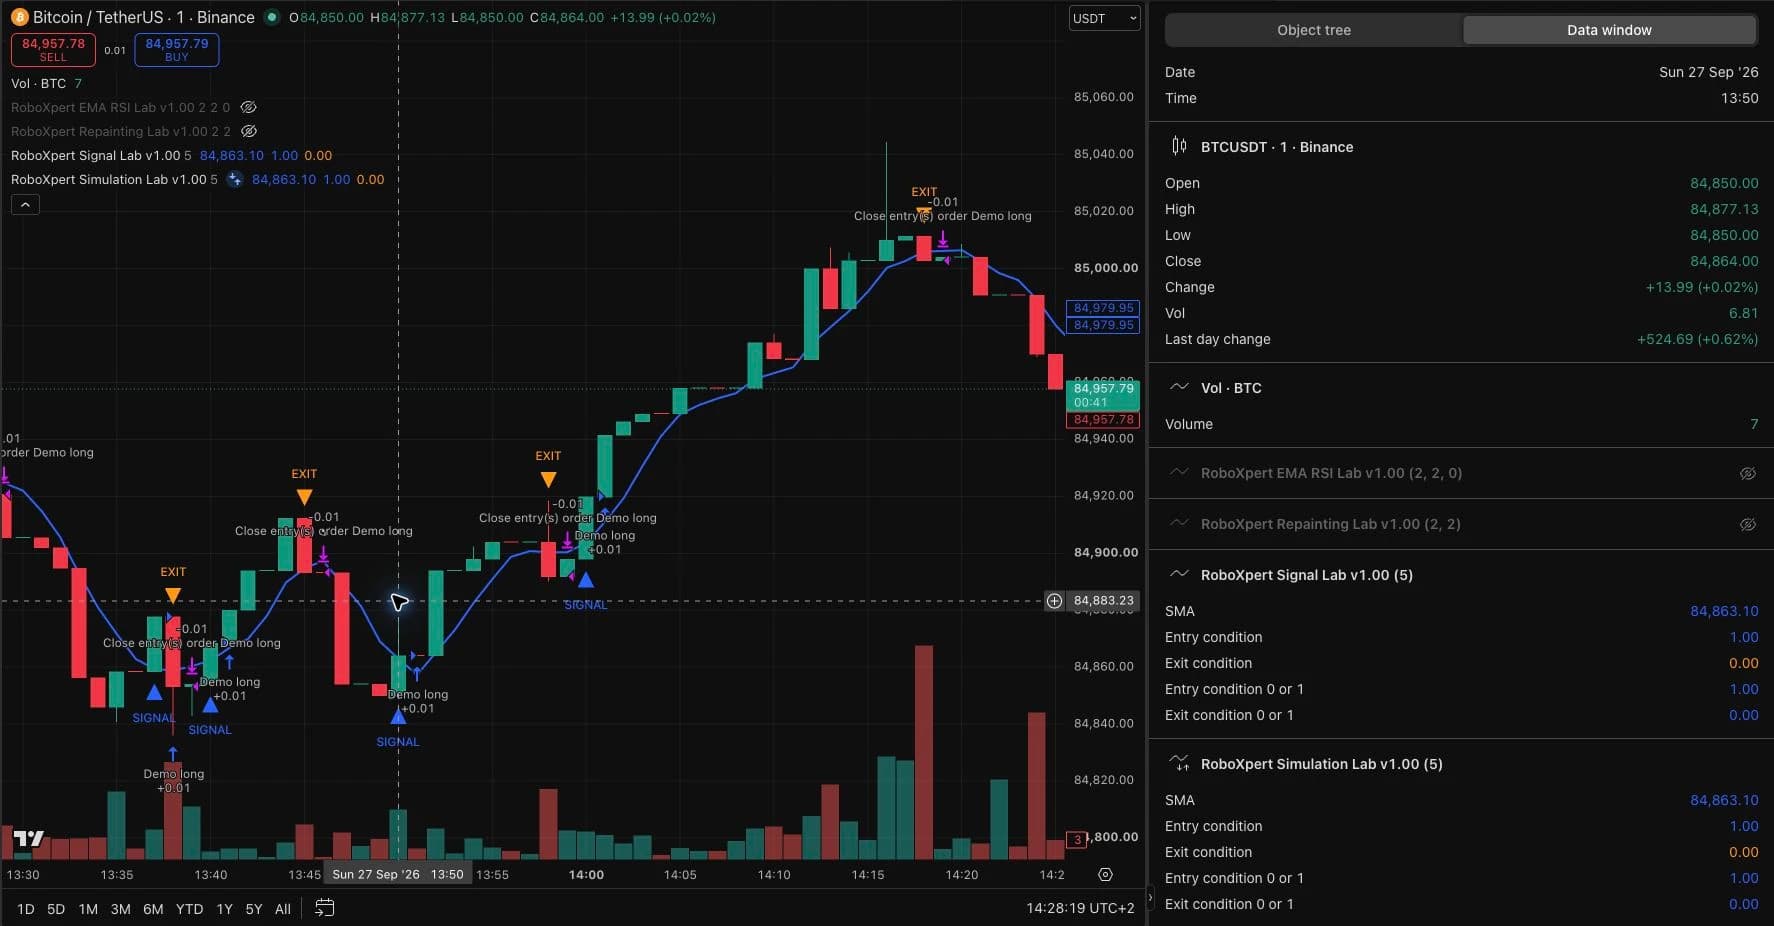
Open the full-size signal capture
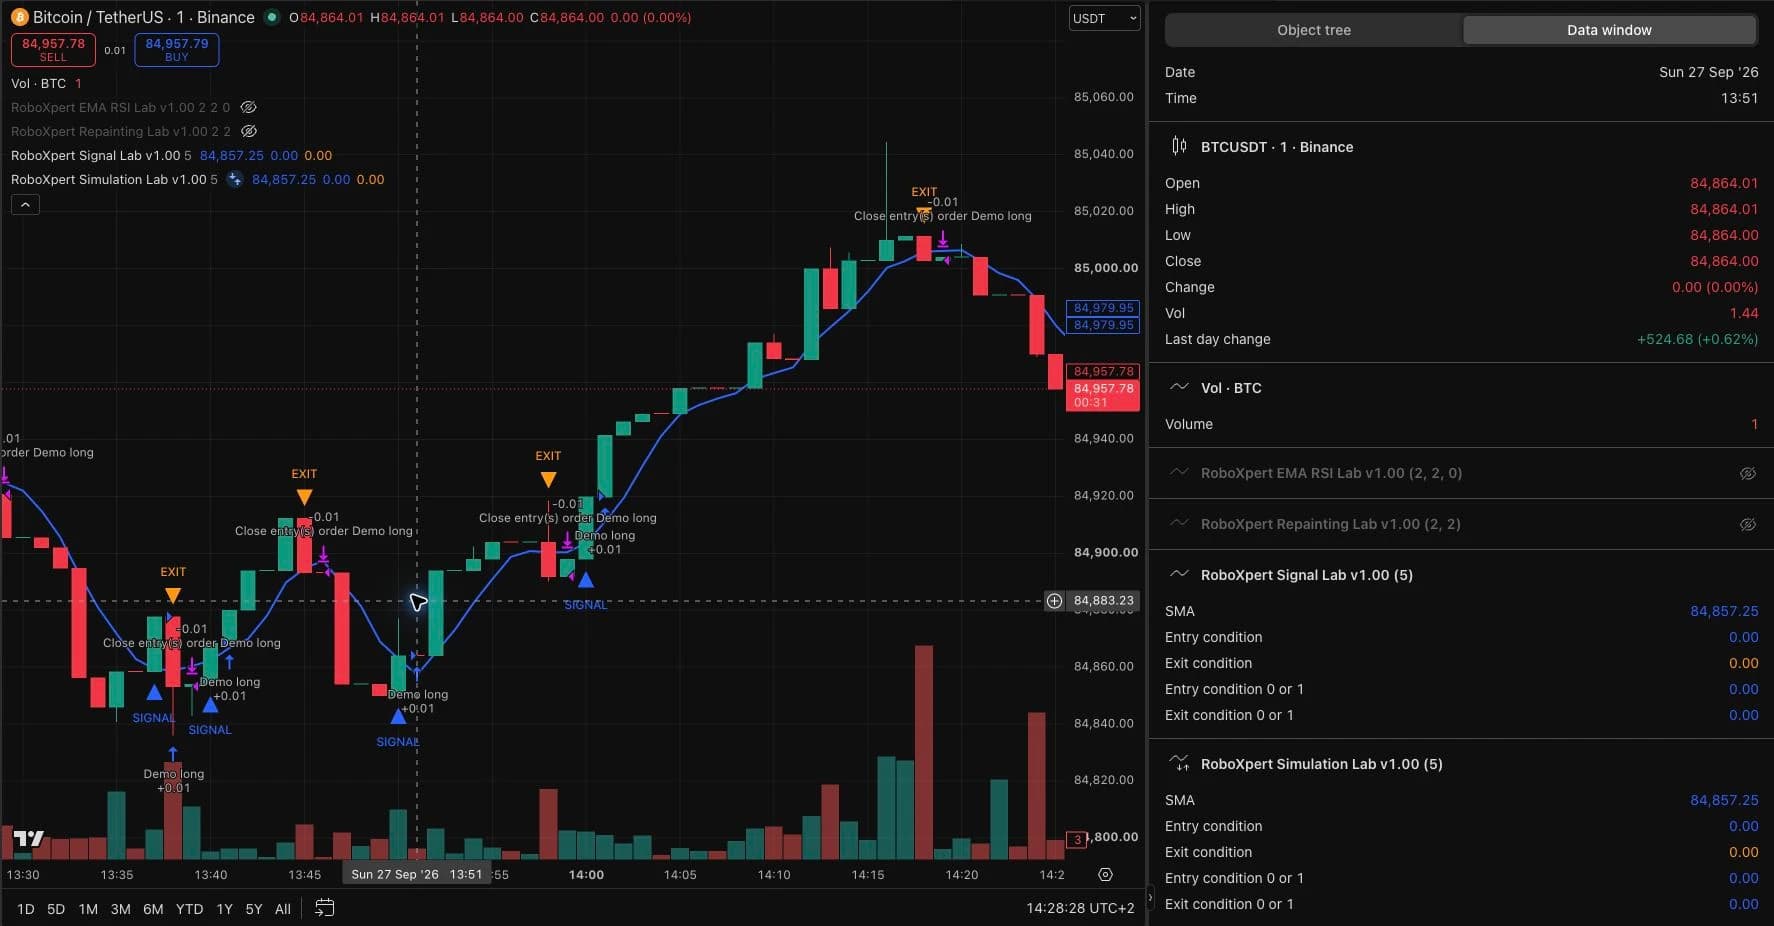
Open the full-size next-bar capture
Our downloadable files preserve the exact script versions and observation record. No external webhook, broker connection or live order was used. This checks the selected signal-to-simulation behavior; it does not validate profitability, alert delivery or every possible signal.
Reader resource · ZIP
Run the indicator–strategy comparison
Two original Pine v6 scripts, exact settings, observation record and a blank comparison worksheet. Educational simulation only; no broker connector.
Download the comparison labWhy does the strategy enter one candle later?
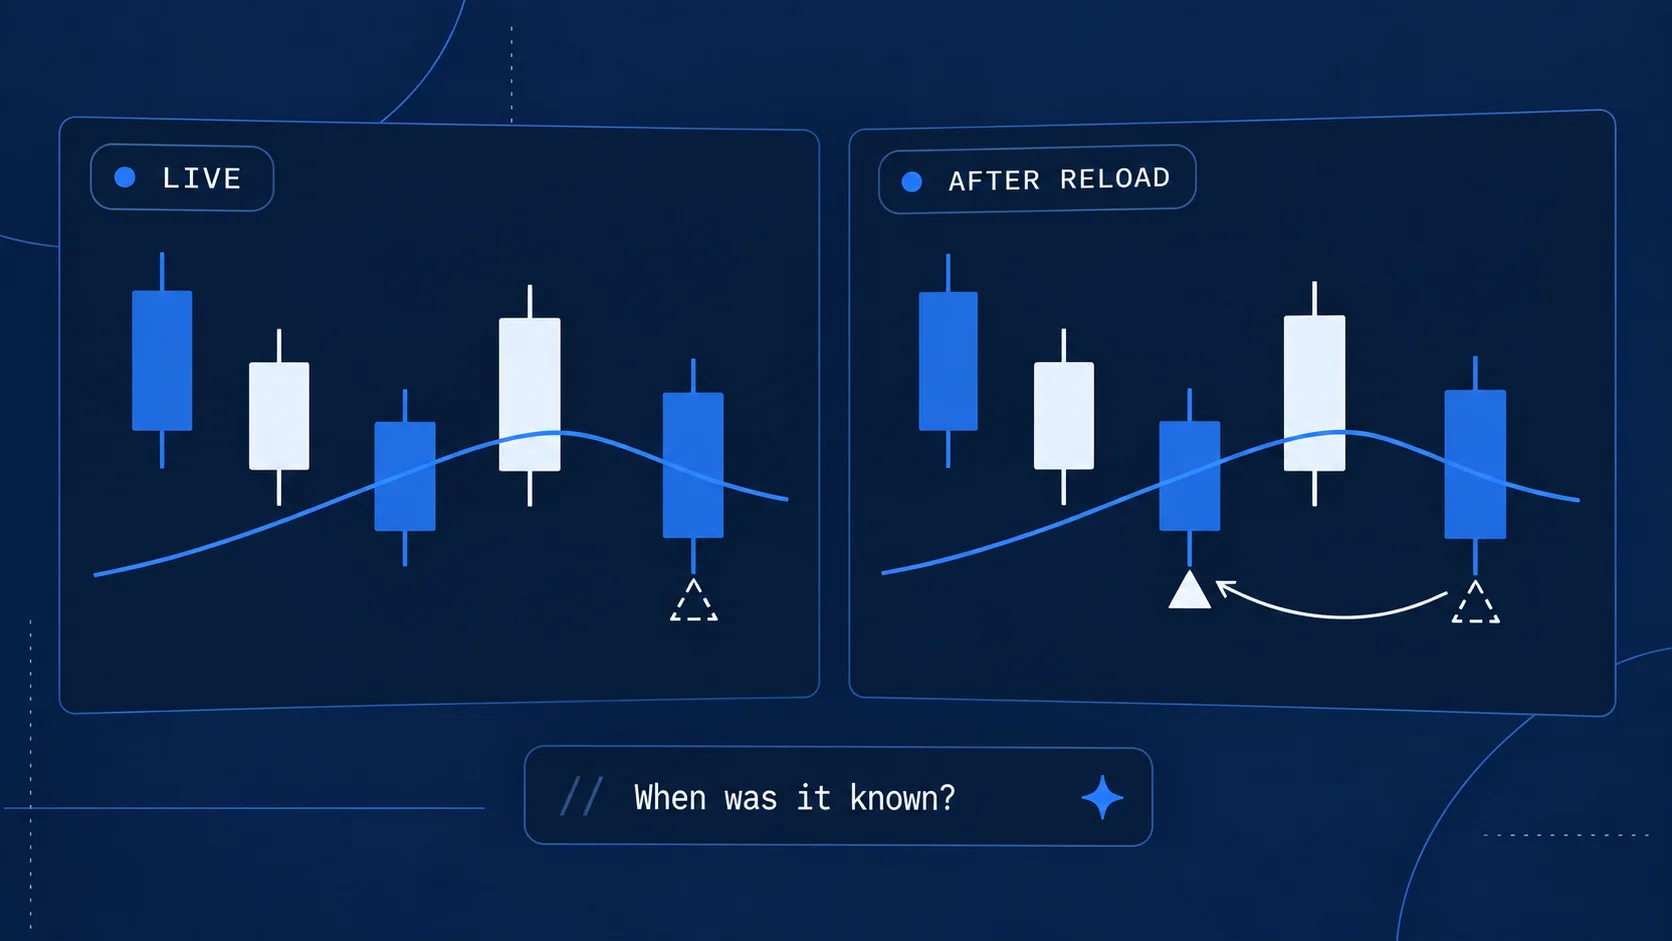
In our example, the completed candle supplies the signal. With process_orders_on_close = false, the emulator can fill the resulting market order on the next available tick. Under the selected close-only calculation setup, that is the next candle’s opening tick. TradingView documents this order creation and fill sequence.
Do not move a plotted signal backward to make it line up with an order. Instead compare three fields: the bar where the condition became known, the bar where an order was created, and the bar where it filled.
Other order types and calculation settings can produce different timing. A limit order may wait for its price; an unfilled order is not a missing indicator signal. Our two-candle observation applies to the specific market-order example above.
Why can their values differ on the open candle?
An indicator normally updates as the realtime bar receives updates. A strategy with our settings waits for the closing calculation. Comparing their current SMA values mid-bar can therefore compare a fresh indicator value with an older strategy value. This difference also appeared in our laboratory’s latest-bar display while we were inspecting the chart.
Compare the same completed candle first. Then examine the actual calculation settings if intrabar behavior matters. TradingView’s execution model explains the different update schedules.
Confirmation alone is not a universal guarantee against repainting. Higher-timeframe inputs, revised data and backward-plotted markers need their own checks. Our repainting experiment addresses that separate task.
Alerts: a condition is not an execution confirmation
The alert mechanism changes what an event means:
Scroll horizontally if needed
| Mechanism | Available in | Event describes |
|---|---|---|
alertcondition() | Indicators | A named condition selected in the alert dialog |
alert() | Indicators and strategies | A call the script makes when its logic permits |
| Strategy order-fill alert | Strategies | A fill in TradingView’s broker emulator |
The Pine code makes events available; you still configure a running alert in the interface. Historical markers are not a historical delivery log. TradingView creates a server-side copy of the script, inputs, symbol and timeframe for a running alert, so changing the chart does not update that existing alert. Recreate it when its intended configuration changes. Official alert documentation.
For our indicator, the two named conditions are Confirmed entry condition and Confirmed exit condition. Their messages explicitly say they are teaching signals. We did not create running alerts for this comparison. Our separate Pine indicator tutorial includes an actual alert-log observation.
Can either one trade automatically?
Not directly through Pine into a connected brokerage account. As checked on 27 September 2026, TradingView’s help states that automated strategy trading with a brokerage account is not available natively. Current platform statement.
A separately configured service can receive alerts and submit instructions elsewhere. The practical chain is:
Script event → running alert → webhook receiver → validated order instruction → broker response → position reconciliation.
Each step needs its own evidence. A visible chart triangle does not prove an alert ran. An alert log does not prove the receiver acted. A successful HTTP response does not prove that the broker filled the intended quantity.
TradingView documents webhook delivery failures and a three-second processing timeout. Treat delivery as something to monitor, not an assumed guarantee. Do not put account passwords in payloads. Webhook requirements and limitations.
Before evaluating a connector, ask it to demonstrate in a non-live environment:
- How a full TradingView symbol maps to the exact destination instrument.
- How quantities are interpreted and capped.
- What happens when the same event arrives twice or too late.
- What happens when the strategy thinks it is flat but the destination has a position.
- Where rejected orders, partial fills and disconnected services become visible.
These are evaluation questions, not a claim that any particular connector passed our tests. This guide does not recommend or benchmark an execution service.
How to convert an indicator into a meaningful strategy
Changing indicator() to strategy() supplies a different script environment. You must still define the missing trading decisions. Write these down before requesting a conversion from a developer or AI:
- Signal timing: what must be known, and at which candle close?
- Entry rule: what creates an order, and what blocks repeated entries?
- Exit rule: a signal, protective stop, target, time limit, or a specified combination?
- Position policy: one position, scaling, reversal, or simultaneous exposure?
- Sizing and costs: units, capital, commissions and slippage assumptions.
- Test conditions: symbol, data source, standard candle type, timeframe and date range.
Then inspect a few trades individually before interpreting aggregate metrics. Our two files show one deliberately narrow conversion: the upward cross starts a simulated long, the downward cross closes it, and other conditions do not create extra positions.
If the source is closed, do not claim that a reconstructed strategy reproduces the seller’s hidden implementation. A visually similar line is not proof of identical event timing.
Common questions
Can I backtest an indicator in TradingView?
An indicator does not generate the built-in strategy report. To test trading outcomes from its signals, you need a strategy with explicit trade rules or a separate testing method. A custom indicator statistics panel requires inspection of its own methodology.
Is a strategy more accurate than an indicator?
The script category does not make its signals better. Our two scripts use the same formula and agree on the selected closed bars. The strategy adds assumptions about position handling and execution; those assumptions can materially change a reported result.
Will connecting Paper Trading make my Pine strategy place paper orders?
The strategy report’s simulated positions and the Paper Trading account are separate mechanisms. Do not interpret a strategy.entry() marker as a transaction in the Trading Panel. Check the destination account’s own order history if evaluating any integration. TradingView’s strategy FAQ explicitly separates Pine from built-in Paper Trading.
Does a profitable backtest prove that automation will work?
It does not establish future returns or the reliability of an execution chain. Review the settings, testing process and difference between backtests and live results. A chart experiment, an alert-delivery test and a broker execution test provide different evidence.

Sources & further reading
- TradingView: community script types
- TradingView: Pine strategies and broker emulator
- TradingView: Pine execution model
- TradingView: Pine alerts
- TradingView: automated trading with Pine strategies
- TradingView: webhook configuration and delivery limits
- TradingView: strategy FAQ and Paper Trading limits
- TradingView: repainting
Your next question