Research
Do Fair Value Gaps Work? A 23,899-Trade Backtest With Costs
At a glance
In our fair value gap (FVG) retest backtest on NQ, ES, EURUSD and XAUUSD, 23,899 completed historical events averaged +0.020R before costs and −0.240R after the stated cost assumptions, where 1R is the width of the gap zone. Two of the twelve market-and-timeframe datasets, NQ 15-minute and NQ 1-hour, were positive after costs; the other ten were negative. This is a mechanical event study with overlapping trades, not a portfolio return or a verdict on every FVG strategy.
On this page

A fair value gap is easy to mark after the chart has unfolded. A test needs more: a definition available at the time, a specific entry, an exit, a cost model and a comparison.
We tested a deliberately simple FVG retest and inverted FVG retest across NQ, ES, EURUSD and XAUUSD on three timeframes. The study was first run on 29 September 2026. For this article, we inspected its implementation and reran all twelve original datasets on 1 October; the results matched the original output apart from the generation timestamp.
The main finding is narrow: this pooled mechanical retest model was negative after the stated costs. It is not proof that all FVG-based strategies fail. A different entry, filter, exit or execution assumption is a different test.
Our follow-up trading cost sensitivity analysis freezes these baseline retest events and varies the cost allowance. It shows the zero-mean thresholds and cost distribution without changing entries or exits.
This event study does not model an account equity curve. A sum of overlapping event outcomes cannot establish equity drawdown; that requires an account path with sizing and simultaneous exposure.
The FVG and inverted FVG retest rules we tested
At the close of bar t, a bullish FVG exists when low[t] > high[t−2]. Its zone lies between the earlier high and the current low. The bearish definition reverses those relationships. This describes a three-candle pattern; it does not by itself prove institutional orders, missing liquidity or future price direction.
Scroll horizontally if needed
| Rule | FVG retest A | Inverted FVG retest B |
|---|---|---|
| Minimum zone size | 0.25 × Wilder ATR(14) | Same original zone |
| Eligible from | The bar after formation | The bar after a close through the far edge |
| Entry | First retest at the near edge, in the gap’s direction | First retest of the broken far edge, against the original gap |
| Stop and target | Opposite edge; target 2 zone widths from the entry level | Other edge; target 2 zone widths from the entry level |
| Expiry | 100 chart bars after formation | Break must occur within 100 bars; retest within 100 bars of the break |
| Time exit | Close after 200 chart bars from the fill | Same |
Here 1R means the original zone width in price units. It is not a percentage of an account. Orders become eligible only after the relevant confirming bar. The session-gap filter rejects a formation when the first-to-third-bar time distance exceeds three chart intervals.
For a hypothetical bullish zone from 100 to 102, the standard A entry level is 102, the stop level is 100 and the target is 106. Those numbers illustrate the rule; they are not a trade from the market sample. A gap through an entry or exit level can alter the realized model payoff.
The engine permits overlapping events from multiple zones. It does not allocate capital, impose margin limits or combine exposures into a tradable portfolio. Do not turn the summed event results into an account-return claim.
Pooled FVG retest results before and after costs
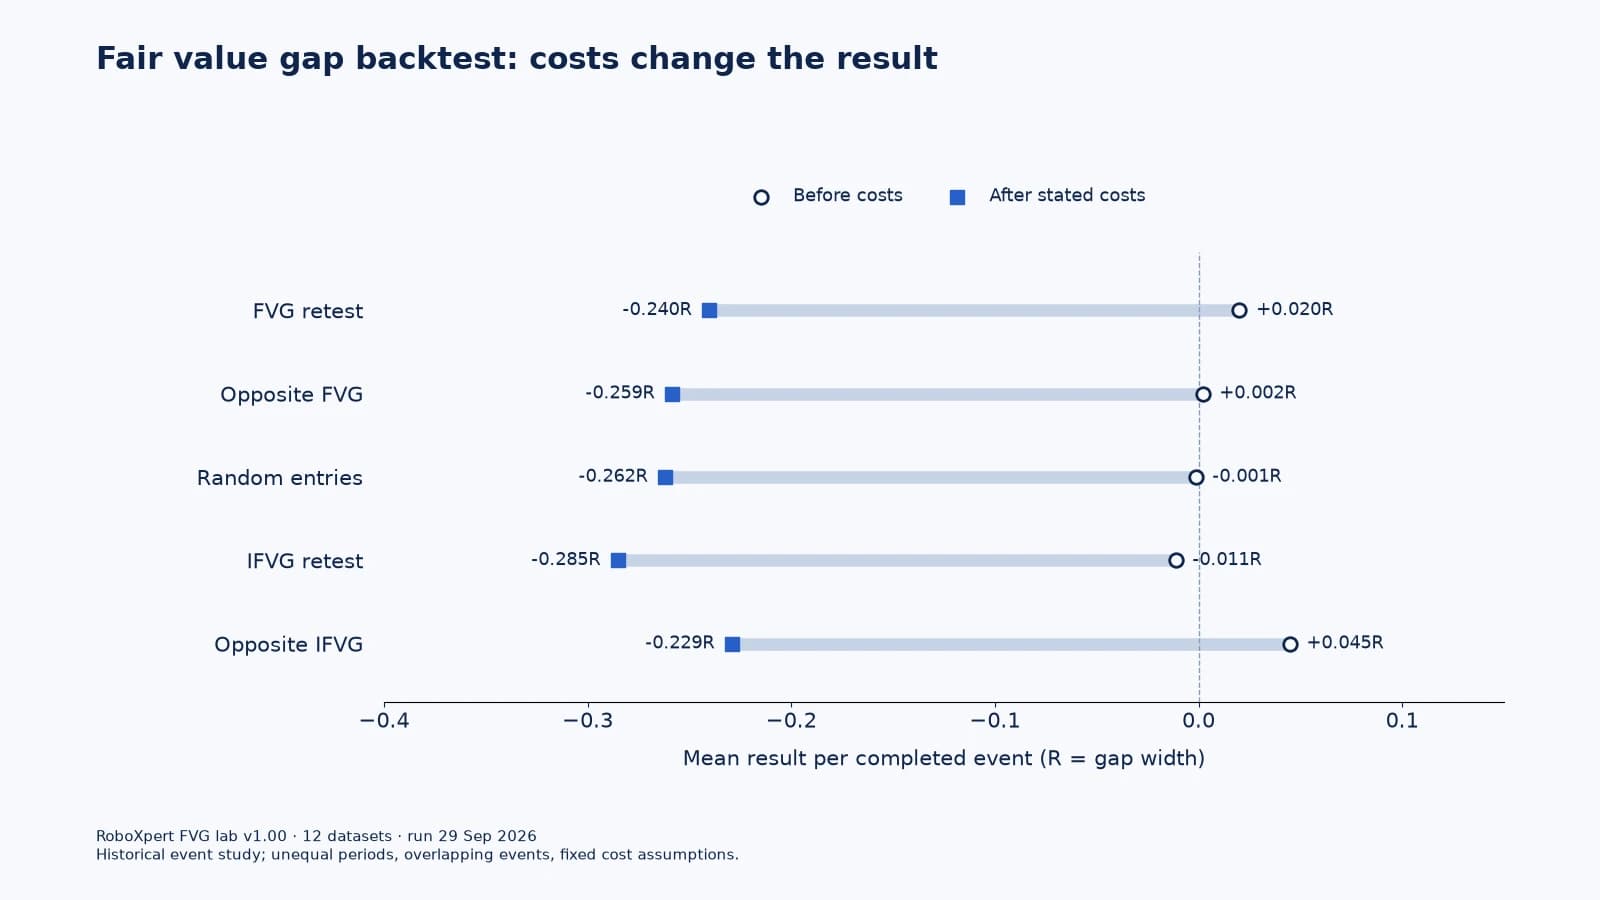
The main setting produced 23,899 completed FVG retest events (model A) and 19,320 completed inverted FVG retest events (model B); each event is one simulated retest trade. The table reports trade-weighted means across all twelve datasets, in R (1R = the zone width of that gap). All five rows, including the opposite-direction and random-entry controls, have a negative mean after the stated cost assumptions.
Scroll horizontally if needed
| Construction | Completed events | Positive after costs | Mean gross R | Mean net R | Net profit factor |
|---|---|---|---|---|---|
| FVG retest A | 23,899 | 33.34% | +0.0201 | −0.2403 | 0.714 |
| Same FVG entries, opposite direction | 23,902 | 32.78% | +0.0020 | −0.2585 | 0.694 |
| Random entries, ten seeds combined | 238,941 | 32.76% | −0.0014 | −0.2619 | 0.691 |
| IFVG retest B | 19,320 | 32.13% | −0.0112 | −0.2851 | 0.670 |
| Same IFVG entries, opposite direction | 19,321 | 34.21% | +0.0448 | −0.2291 | 0.726 |
Positive after costs means net R greater than zero. It is not the same metric as reaching the 2R target. The FVG retest model’s (A) gross-positive share was 33.80%. The familiar 33.33% gross break-even rate assumes every trade ends at exactly −1R or +2R; time exits, gaps and costs mean that shortcut does not describe the net results above.
The opposite-direction controls reuse the model entry opportunities. Counts differ slightly because the engine omits positions that remain unfinished at the dataset’s end. The random control chooses chart bars and directions with fixed seeds 0–9 and draws risk sizes from completed A events in the same dataset. Ten seeds provide repeated simulations on the same history—not ten independent market histories.
Results by market and timeframe
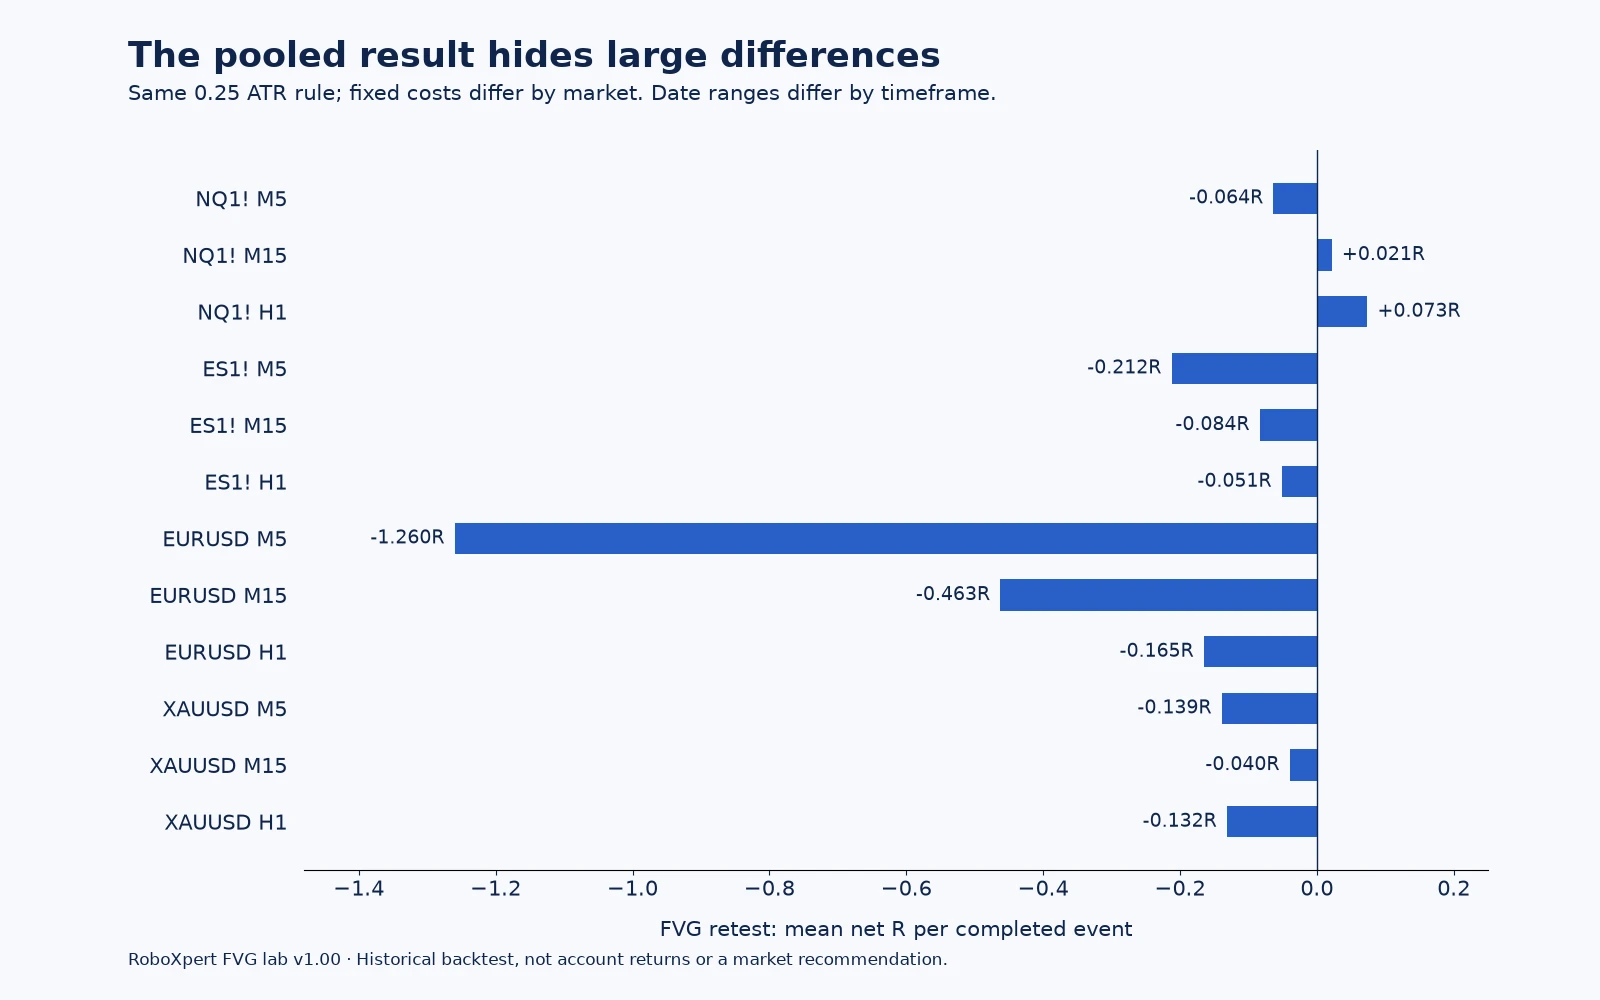
Some cells were positive. Selecting only those cells would tell a different story from the pooled result, but would also select winners after seeing the results.
Scroll horizontally if needed
| Dataset | Intrabar data | Sample starts, UTC | FVG retest (A) events | Mean gross R | Mean net R |
|---|---|---|---|---|---|
| NQ M5 | 1m | 18 Jun 2026 | 2,030 | −0.0191 | −0.0636 |
| NQ M15 | 3m | 21 Nov 2025 | 1,877 | +0.0502 | +0.0215 |
| NQ H1 | 15m | 30 Apr 2023 | 1,834 | +0.0913 | +0.0735 |
| ES M5 | 1m | 18 Jun 2026 | 2,073 | +0.0131 | −0.2124 |
| ES M15 | 3m | 21 Nov 2025 | 1,859 | +0.0287 | −0.0836 |
| ES H1 | 15m | 30 Apr 2023 | 1,815 | +0.0109 | −0.0514 |
| EURUSD M5 | 1m | 23 Jun 2026 | 2,534 | −0.0556 | −1.2599 |
| EURUSD M15 | 3m | 8 Dec 2025 | 2,115 | +0.0575 | −0.4627 |
| EURUSD H1 | 15m | 2 Jul 2023 | 1,853 | +0.0484 | −0.1652 |
| XAUUSD M5 | 1m | 18 Jun 2026 | 2,168 | +0.0321 | −0.1391 |
| XAUUSD M15 | 3m | 21 Nov 2025 | 1,851 | +0.0402 | −0.0398 |
| XAUUSD H1 | 15m | 30 Apr 2023 | 1,890 | −0.0302 | −0.1315 |
All samples end on 29 September 2026, between 10:00 and 10:30 UTC; exact first/last timestamps and file hashes are in the download. Each retained sample contains approximately 20,000 chart bars. The histories overlap and have unequal lengths, so this is not an equal-period tournament between timeframes.
Futures (TradingView symbols NQ1! and ES1!) came from TradingView’s delayed CME_MINI_DL continuous-contract feeds; EURUSD and XAUUSD came from OANDA. The export did not establish the futures back-adjustment state conclusively. Roll-period jumps remain in the data. We have not verified these results against individual futures contracts or another data provider.
Why small gaps can be expensive to trade
The engine subtracts a fixed round-trip cost in price units, divided by each event’s zone width:
cost in R = assumed round-trip cost / zone width
net R = model gross R − cost in R
Scroll horizontally if needed
| Market | Assumed round-trip cost in price units |
|---|---|
| NQ | 0.50 index points |
| ES | 0.35 index points |
| EURUSD | 0.00012, equivalent to 1.2 pips |
| XAUUSD | 0.35 USD per ounce in quoted price |
These are study assumptions, not current broker quotes or a complete execution model. They stand in for friction; actual spread, commissions, slippage, financing and fills depend on the instrument and venue.
For a hypothetical EURUSD gap of 0.00012, the assumed 0.00012 round-trip cost is 1R. That explains how a narrow stop can make apparently small price costs large relative to the model risk. In the actual EURUSD M5 sample, the median cost was 1R and the mean gross/net difference was about 1.204R. A median is not the average deduction.
Changing the minimum gap size also changed the selected events. With no ATR minimum, the FVG retest model’s (A) mean net result was −0.9454R across 45,660 events; with a 0.5 ATR minimum, it was −0.1358R across 11,812. Both remained negative under the same market cost assumptions. These are the two predefined sensitivity settings, not an optimized threshold recommendation.
Later-period and direction checks
The engine divides each dataset at 70% of its retained bars and assigns events by their fill time. No parameter is fitted on the first segment.
Scroll horizontally if needed
| Construction | Earlier 70%: events / mean net R | Later 30%: events / mean net R |
|---|---|---|
| FVG A | 16,714 / −0.2290R | 7,185 / −0.2666R |
| IFVG B | 13,502 / −0.2800R | 5,818 / −0.2970R |
This is a historical stability check. The result file calls the later segment “out of sample”, but the split does not purge trades crossing the boundary, and the random-control risk distribution uses completed events across the full dataset. It is not an untouched prospective trial, a demo-forward test or live evidence. See backtests versus forward and live results.
A separate symmetric ±1R test asks which side is reached first from the entry level. The expected-direction share was 49.49% for FVG and 47.49% for IFVG, among resolved bracket outcomes. This is a different question from winning at a 2R target after costs.
The original output contains 95% Wilson intervals. We retain them for transparency but do not use them to claim statistical significance here: overlapping events and repeated market histories are not independent trials. Dependence-aware inference needs an appropriate design; ordinary interval overlap also does not establish equivalence. Zhang and Cheng’s research on dependent time-series inference explains why dependence must be addressed, but its method has not been implemented in this study.
What the simulation can still get wrong
Intrabar order matters. Entries and exits are evaluated in lower-timeframe bars, each following an assumed OHLC path. The chart/intrabar mapping is 5m→1m, 15m→3m, 1h→15m. We did not resolve every trade with one-minute data or market ticks. The path is based on the OHLC convention described in TradingView’s broker-emulator documentation; the study itself runs in Python.
A touched limit is assumed filled. There is no order queue, partial fill or bid/ask reconstruction. An added cost allowance cannot demonstrate that an order would have filled. Six retained chart bars have an intrabar range mismatch. The final exported bar may be incomplete, and ATR is seeded on the retained history. These are reasons to investigate sensitivity further, not to describe the output as exact execution.
The validation is bounded. The engine’s synthetic random-walk checks compared modeled outcomes with known tick paths, with agreement between 99.29% and 100% for those checks. That validates particular code paths; it does not establish that much accuracy on real market data.
The most attractive cell is selected after inspection. NQ H1 had the highest mean net result here. We cannot infer that it is a repeatable trading edge—or prove that luck caused it—from this table alone. The selection experiment in our Expert Advisor guide illustrates the same selection problem in a simplified probability model. Bailey and co-authors’ backtest-overfitting paper addresses the broader selection problem. We did not compute their overfitting estimator.
Download, inspect and reproduce
Reader resource · ZIP
Inspect the FVG study and reproduce the calculation
Python engine, Pine exporter, original protocol, aggregate results, file hashes and publication review. Raw market exports are not included.
Download the code and resultsThe archive contains the original Python v1.00 engine, Pine data exporter, dated local protocol, aggregate JSON results, manifests and the 1 October publication review. The review qualifies earlier shorthand such as “coin flip”, the interpretation of confidence intervals and the use of “out of sample”. The original experiment files are preserved so the qualification is visible.
The local protocol records that rules were fixed before the first run. We have not established an independently timestamped public preregistration. The raw TradingView market exports are not redistributed: you need permitted data in the documented format to rerun the market calculation. You can run the synthetic checks without market data:
python3 analyze.py --verify
python3 analyze.py datasets.json --out my-results.json
For exact replication, compare the raw-file hashes, settings and retained time ranges. A new export can contain a different history or revised data. The code and original documentation were developed with AI assistance; this article reports an implementation review and repeated calculation, not independent peer review.
Common questions
Does this show that FVG trading never works?
No. It shows the outcomes of the stated mechanical rules, samples and cost assumptions. Additional filters or discretionary selection require their own defined test. They cannot borrow a profitable result from a different setup or dismiss the losing baseline without showing what changes.
Is a high gap-fill rate enough?
No. Returning to a zone is an entry or path event. Profit depends on what happens after the chosen entry, the exits and costs. This study evaluates specified retest trades; it does not report a universal percentage of all gaps eventually filled.
What would improve the evidence?
Independent data, confirmed contract handling, execution sensitivity, dependence-aware statistics and a prospectively frozen test would strengthen it. A portfolio version would also need explicit capital and exposure rules. The next useful question is whether a precisely defined improvement survives those checks, not whether one attractive chart is persuasive.

Sources & further reading
Your next question