Learn
100% a Month With a Trading Indicator? A Reality Check
At a glance
A single month in which an account doubles does not establish a repeatable income stream or prove that an indicator caused the result. Examine the full account record, losses, costs, position sizing and when signals were available. No universal monthly return can be inferred from an indicator's name, price or win rate.
On this page

If you are looking for a trading indicator that can double your account in a month, it is worth slowing down before you pay for one. A chart full of winning arrows can make a difficult, uncertain activity look like a simple purchase.
A 100% gain in one month is not mathematically impossible. It is also not evidence that you can repeat it every month, that the risk was acceptable, or that buying the same indicator will reproduce the result. A claimed monthly return needs an account record and a description of the risks behind it.
This guide examines the claim, not a particular seller. The calculations below are hypothetical arithmetic, not a backtest, live result, forecast or recommended target. There are no affiliate links in this article.
Can a trading indicator make you rich?
An indicator can organise information, mark a condition or help apply a consistent rule. That does not establish a profitable trading system. You still need rules for entries and exits, position sizing, costs and what happens when the signal is wrong.
Even an accurate chart observation does not tell you how much of your account to expose or how an order will be filled. On TradingView, a strategy can simulate trades through a broker emulator; the report remains a simulation. TradingView's strategy documentation explains how costs and execution assumptions affect those results.
The useful question before buying is: what, exactly, has been demonstrated about this tool under conditions that match its intended use?
What 100% every month actually means
A 100% return means doubling the starting amount for that period. If someone claims this can happen every month and all gains remain invested, the implied growth is exponential.
Hypothetical calculation: start with $1,000, double the account at each month-end, retain all gains, and make no deposits or withdrawals. No separate deductions for fees or taxes are modelled. This table illustrates the claim; it does not forecast a trading account.
Scroll horizontally if needed
| Completed months | Implied account value |
|---|---|
| 0 | $1,000 |
| 1 | $2,000 |
| 3 | $8,000 |
| 6 | $64,000 |
| 12 | $4,096,000 |
The formula is starting amount × 2^months. After twelve doublings, the account would be 4,096 times its starting value: a cumulative gain of 409,500%.
This does not prove that a particular screenshot is fabricated. It shows the scale of a claim about repeating the result. Ask whether the seller means one selected month, the best month in a record, an average, or every month. Those are different claims.
If gains are withdrawn instead of reinvested, the table no longer applies. That changes the arithmetic, not the need to substantiate the promised returns.
A spectacular month can hide an unattractive risk
A return without its losses and exposure is incomplete evidence. Compare the full equity history, not just the final balance or the winning trades. Open losses can sit outside a closed-trade balance figure; our equity versus balance drawdown guide explains the distinction.
Hypothetical example: $1,000 rises by 100% to $2,000, then falls by 50% to $1,000. The two-period result is 0%, before any separately charged costs. Averaging the two percentages gives +25%, which does not describe the actual growth of that account.
A 50% loss needs a 100% gain on the remaining capital just to recover. Both statements follow from the changing base; neither predicts what will happen next.
Increasing position size can amplify losses as well as gains. A target written in a spreadsheet does not create a trading advantage. And a strong result on a small account does not itself establish that the same method scales to a much larger one.
A 90% win rate can still lose money
Win rate counts how often trades win. It does not tell you the size of the wins and losses.
Hypothetical fixed-dollar example, before costs: nine trades make $10 each and one loses $100. The win rate is 90%, but the total is 9 × $10 − $100 = −$10. Fees would reduce it further.
Before relying on a headline win rate, ask how a win is defined, whether every trade is included, how open positions are treated, and what the average loss was. A set of historical arrows is not automatically a record of executable, profitable trades.
Why the historical chart may look easier than live trading
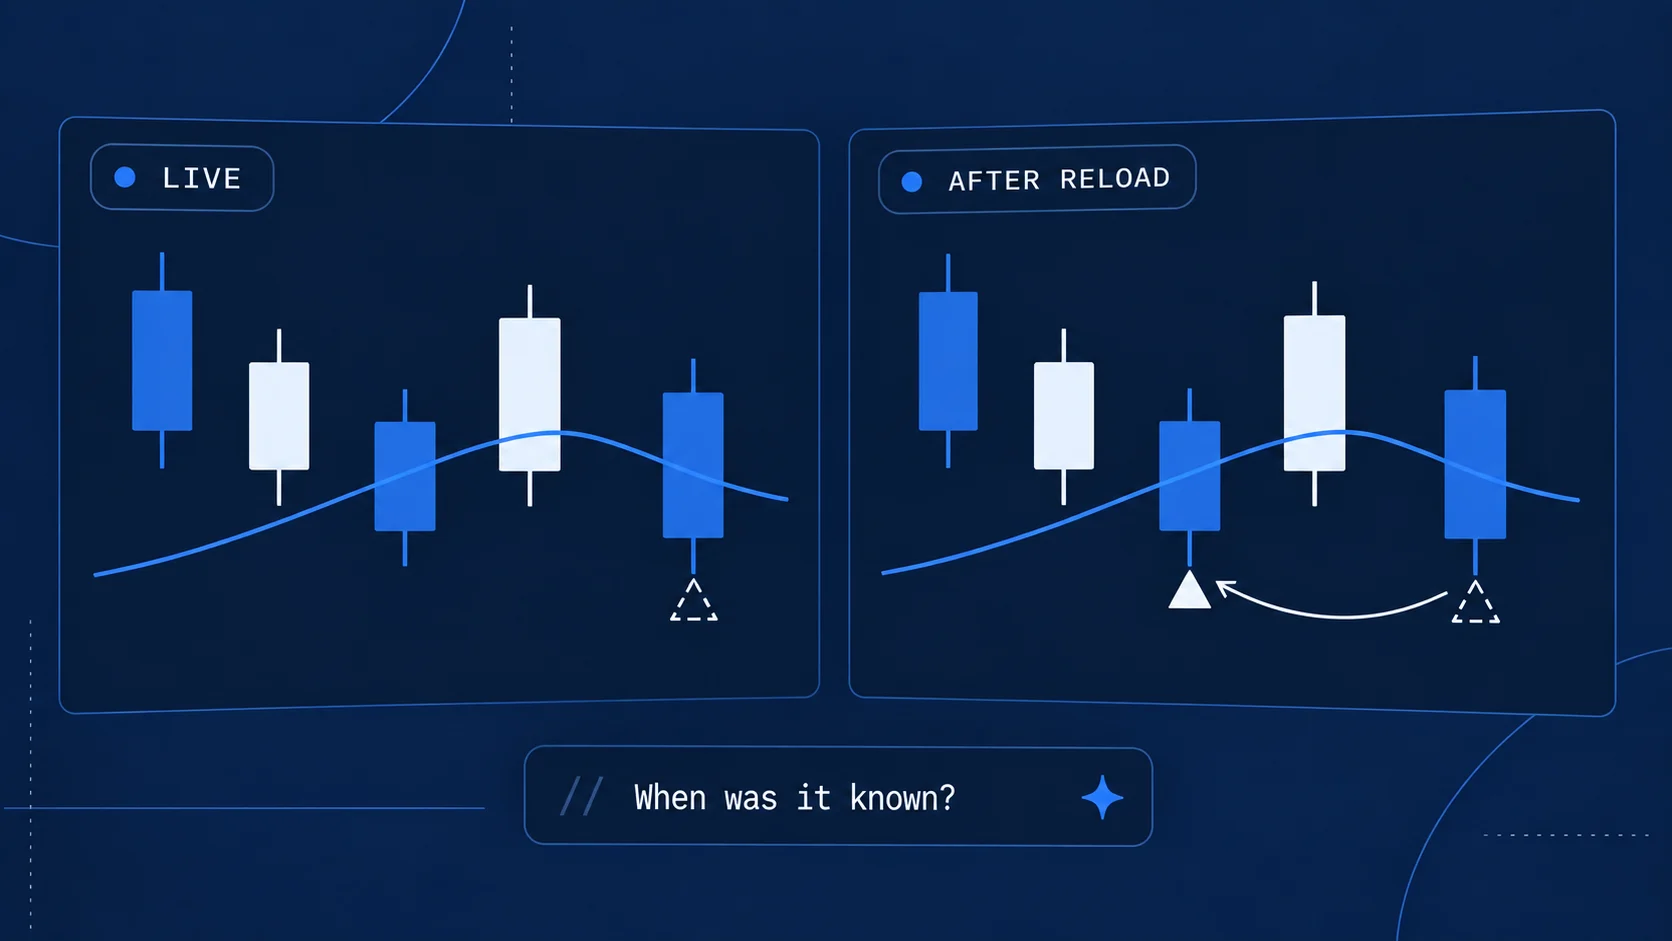
Some indicator values change while a candle is open. Other scripts draw markers on earlier bars after later information becomes available. Those behaviours need an explanation; the label “non-repainting” is not a substitute for checking the actual script.
Compare what a signal showed before the outcome, after the candle closed and after reloading. For a practical method and original chart evidence, use our TradingView repainting checks. TradingView's repainting documentation describes these timing differences.
Also separate a historical simulation from a demo-forward run and from trading with actual money. A carefully configured backtest can help investigate rules; it cannot demonstrate future monthly income. See backtest versus live trading for the evidence boundaries.
Does AI change the answer?
AI can help write code or analyse information. The label does not establish that the strategy has an advantage, that its output was tested correctly, or that future profits are predictable.
The US CFTC has specifically warned about AI trading-bot and signal claims, including unusually high or guaranteed returns. Treat a guarantee or an unexplained return claim as a reason for scrutiny, rather than treating every AI tool as fraudulent.
Ask what AI actually does: generate the code, classify data, produce signals or make execution decisions. Then evaluate the evidence for that function. AI-written code and AI making trading decisions are different things.
Seven questions before you buy
Scroll horizontally if needed
| Question | What the answer should clarify |
|---|---|
| What does “100%” measure? | Full-account return, one position's return, a selected month, win rate or something else. |
| Is this live, demo or simulated? | Account type, original evidence source and complete start/end dates. |
| What happened in losing periods? | Equity history, open exposure, drawdown and the months outside the headline example. |
| Which costs are included? | Spread, commissions, slippage, financing and the indicator subscription where relevant. |
| Were the signals available at the time? | Signal timing, candle confirmation, backdated plots and higher-timeframe dependencies. |
| Can the result be attributed to this tool? | Exact version, settings, entry/exit rules, sizing and any manual intervention or other systems. |
| Who benefits if I buy? | Seller identity, clear terms and disclosed commercial relationships. |
An unanswered question is a limit on what you can conclude. It is not automatically proof of fraud. Equally, a verification badge does not guarantee future returns or prove that one named tool generated all the trades. Our account-verification guide explains that distinction.
What monthly return is realistic?
There is no universal monthly percentage that follows from buying an indicator. Replacing “100% a month” with an unsupported promise of “a safe 2%” or “a realistic 10%” leaves the same evidence problem.
Evaluate the complete observed record and its conditions. A longer record can be more informative than one winning month, but length alone is not a guarantee: methods, exposure and market conditions can change. None of this makes a future monthly return a salary.
If the money is needed for bills or debt repayments, do not treat uncertain trading gains as committed income. A demo can help you learn the mechanics without committing live trading capital, but demo performance still does not establish live profitability.
The next step is evidence
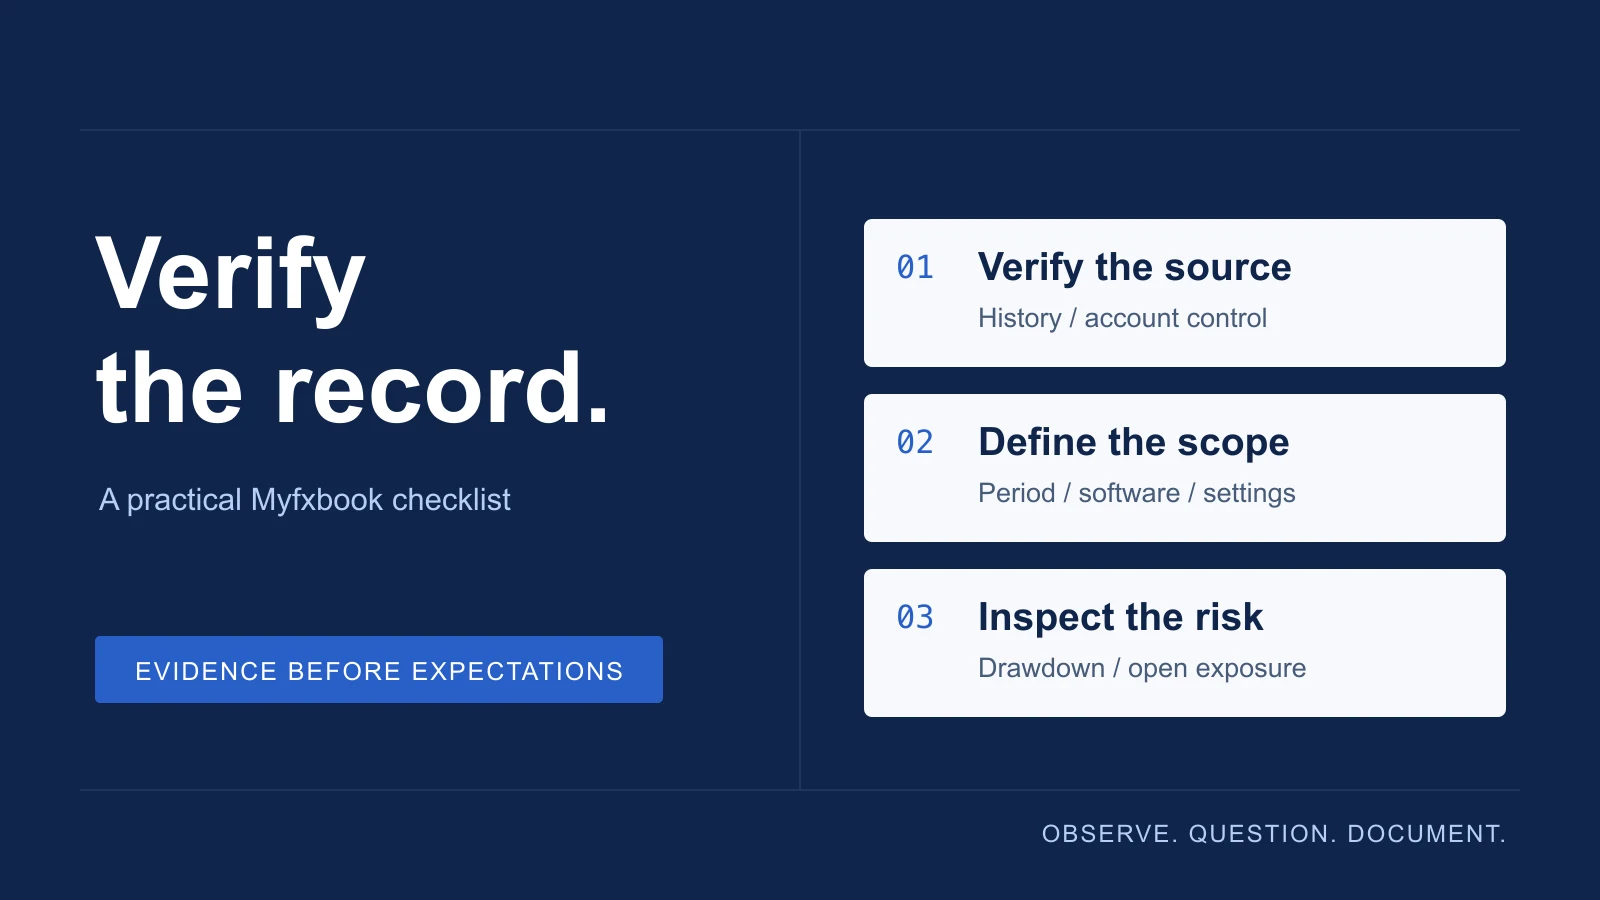
You do not have to buy a tool to examine the claim. Start with its record, risk and signal timing. If those cannot be explained, you do not have enough information to treat the advertised income as a reliable expectation.
The calculations in this guide are reproducible examples. They are not results from our software, an investment recommendation or an endorsement of any named trading product. Sources checked on 26 September 2026.

Sources & further reading
Your next question