Learn
Gold Fell From Its Record: Does Your Gold EA Survive a Regime Change?
At a glance
A gold EA, an Expert Advisor that trades XAUUSD, can look good in a backtest because gold rose for most of the period, and then lose money when the direction changes. In our MT5 backtest, gold rose by 3,272 USD per ounce to a record of 5,335.13 on 29 January 2026, fell by 1,343 USD to 3,992.12 on 16 July 2026 and then moved sideways. A rule that bought every day made +4,522 USD in the rise, lost 9,445 USD in the fall and made +1,514 USD afterwards, with 0.10 lots on a 10,000 USD deposit. A rule that sold every day did the opposite. Ten coin-flip runs on the same prices changed their sign from one phase to the next as well, and only one of the ten was ahead in all three phases. This guide shows how to split your own gold EA backtest into phases and what to read from each part.
On this page
A gold EA that was tested while gold rose has not yet been tested on a fall. In our own test, gold climbed to a record of 5,335.13 USD per ounce on 29 January 2026 and then fell to 3,992.12 USD by 16 July. A rule that earned money in the rise lost twice as much in the fall.
This guide shows what that looks like in numbers and how you can split the backtest of any gold EA into phases. It uses the test runs of our gold benchmark guide, which you can download and repeat. It reviews no gold EA and gives no view on where gold goes next.
Disclosure: RoboXpert develops trading software and has a commercial interest in this subject. We show no result of any of our products here, only simple teaching rules. The tests ran on 7 October 2026 in MetaTrader 5 build 6230 on a demo server. They are backtests, not a forecast and not a recommendation to buy, sell or hold gold. AI assisted with research, calculation and drafting. See our editorial methodology.
What a change of regime means for a gold EA
A regime is a stretch of market with a recognisable character: a steady rise, a fall, a sideways range. A change of regime is the point where that character changes. Many EA rules carry a hidden assumption about the regime. A rule that buys dips assumes that prices come back up, and a rule that follows breakouts assumes that moves continue. Such a rule can be sound in one regime and lose steadily in another.
The assumption stays hidden because a backtest reports one total. If gold rises in most of the tested period, a rule with a long bias collects profit in most of it, and the total looks like skill. Our gold benchmark guide showed this with buy-and-hold and a coin flip. This guide asks the next question: what happens to the same rules when the market turns?
The phases below are cut in hindsight, at the highest and the lowest 20:00 price of our test. That is fine for looking at a result and not for tuning an EA to it. Settings picked because they handled the fall best would only be a new curve fit (see our guide on curve fitting).
Three phases of one gold test
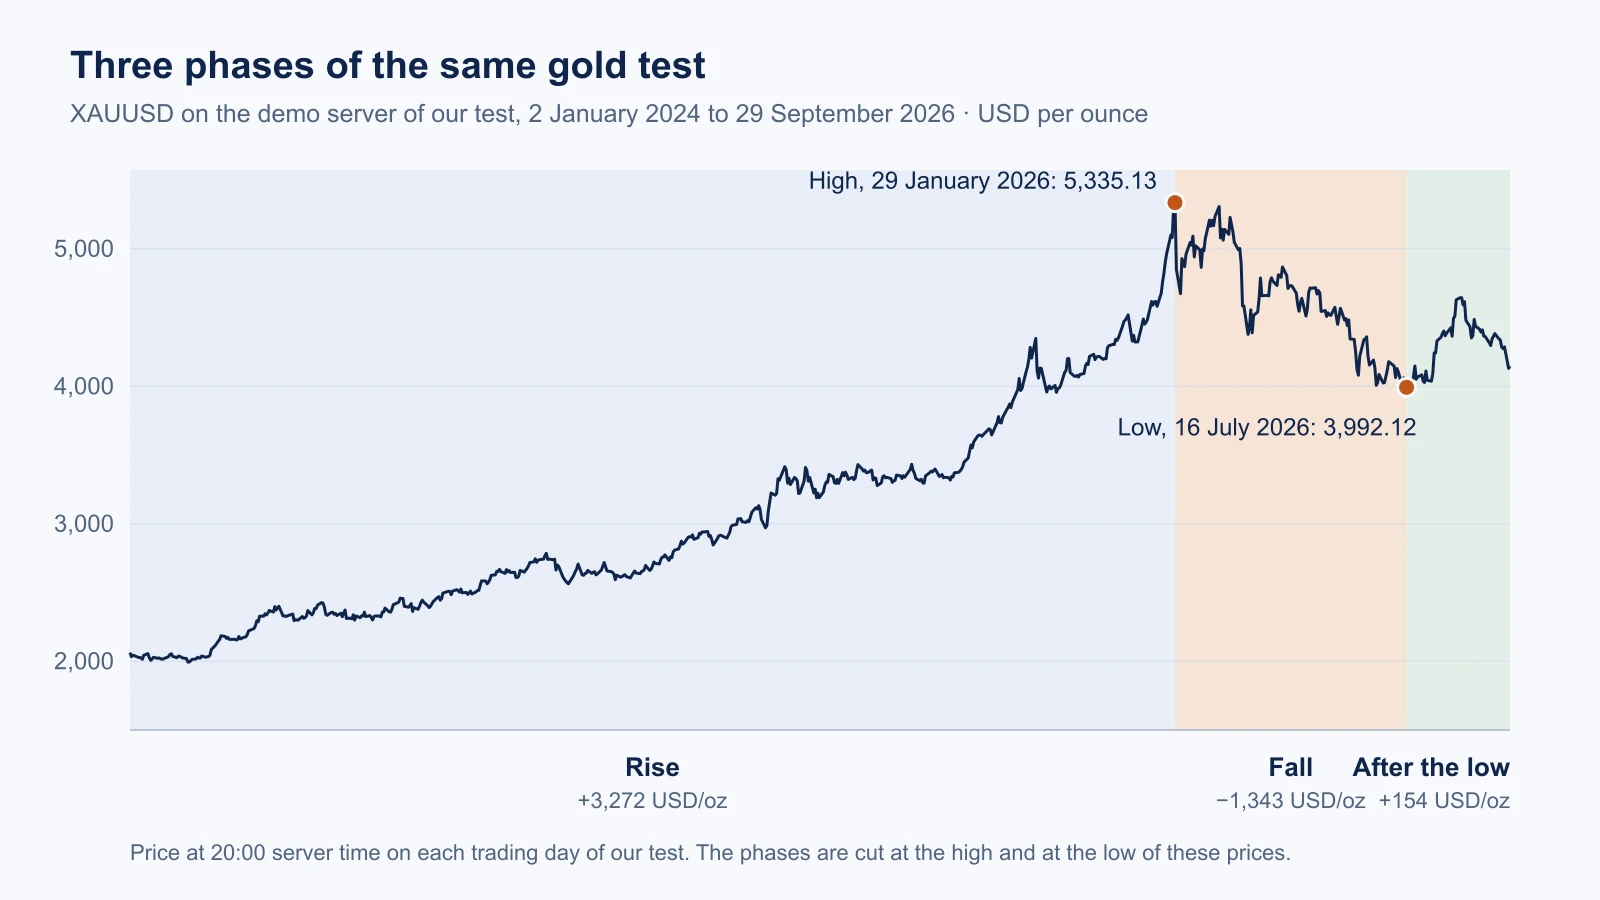
The settings are those of the benchmark: XAUUSD, H1, 1 minute OHLC, History Quality 99%, 1 January 2024 to 30 September 2026, 10,000 USD deposit, 0.10 lots (10 ounces). The 709 trading days fall into three phases:
Scroll horizontally if needed
| Phase | Trading days | Gold price at 20:00 | Change per ounce | Price change of 10 ounces |
|---|---|---|---|---|
| Rise | 537 (to 29 January 2026) | 2,062.81 to 5,335.13 | +3,272.32 USD | +32,723 USD |
| Fall | 119 (to 16 July 2026) | 5,335.13 to 3,992.12 | −1,343.01 USD | −13,430 USD |
| After the low | 53 (to 29 September 2026) | 3,992.12 to 4,145.71 | +153.59 USD | +1,536 USD |
The last column is arithmetic on the 20:00 prices, before swap. It is not the result of a tester run. It shows the size of the swing: someone who held 10 ounces through the whole rise and the fall gave back 41% of the rise gain on paper before the price steadied.
What two fixed rules did in each phase
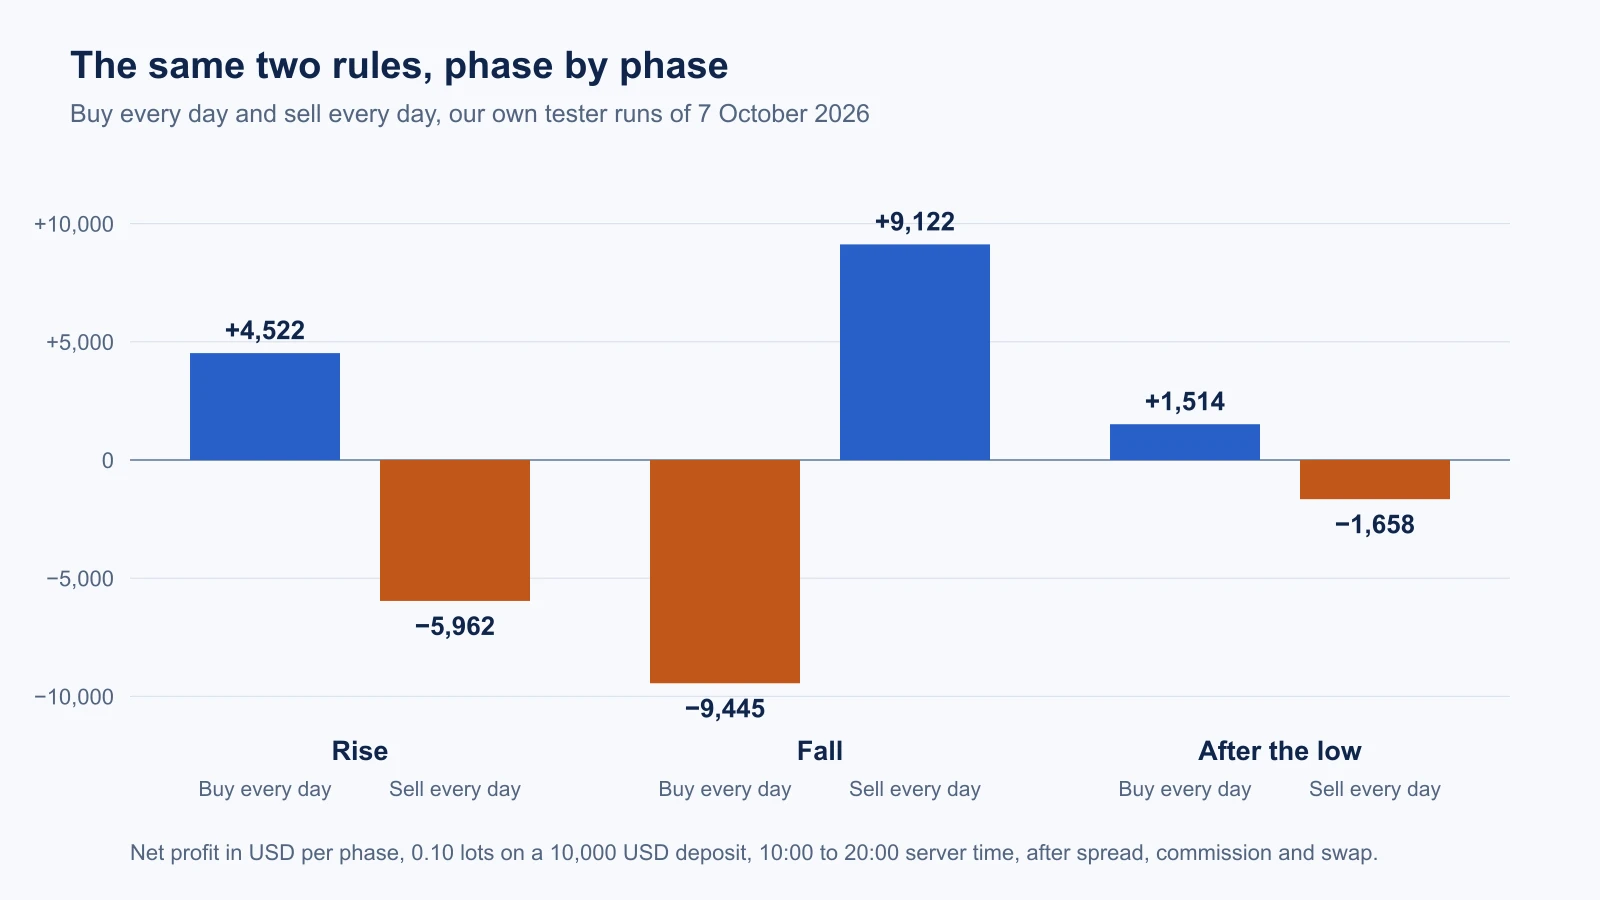
Two rules from the benchmark make the effect easy to see. One buys at 10:00 server time and closes at 20:00 every day, the other sells in the same window. Neither looks at a chart.
Scroll horizontally if needed
| Phase | Buy every day | Sell every day |
|---|---|---|
| Rise | +4,522 USD | −5,962 USD |
| Fall | −9,445 USD | +9,122 USD |
| After the low | +1,514 USD | −1,658 USD |
| Whole test | −3,409 USD | +1,502 USD |
Three things stand out.
The sign follows the phase. Each rule is right in one phase and wrong in the other. Whoever only looks at the whole-test line sees that the buyer lost and the seller won, and learns nothing about why.
The balance fell a long way in the fall. The buying rule stood at 14,522 USD on 29 January 2026 and at 5,077 USD on 16 July, a fall of 65% of the balance in 119 trading days. These are closed trades only. The report’s equity drawdown for the whole test was 88%. The selling rule had the same experience in the rise: from 10,000 to 4,038 USD, a fall of 60% by January 2026, before the fall brought it back to 13,159 USD.
A good phase warns of nothing. In the rise the buying rule looked like a working idea with +4,522 USD. Nothing in that phase would have warned you about the 9,445 USD it gave back in the next.
Ten coin flips changed sign too
The coin-flip rule has no direction at all: it picks buy or sell at random each day. Over the whole test, eight of ten runs ended with a profit. Phase by phase, the picture is less clear.
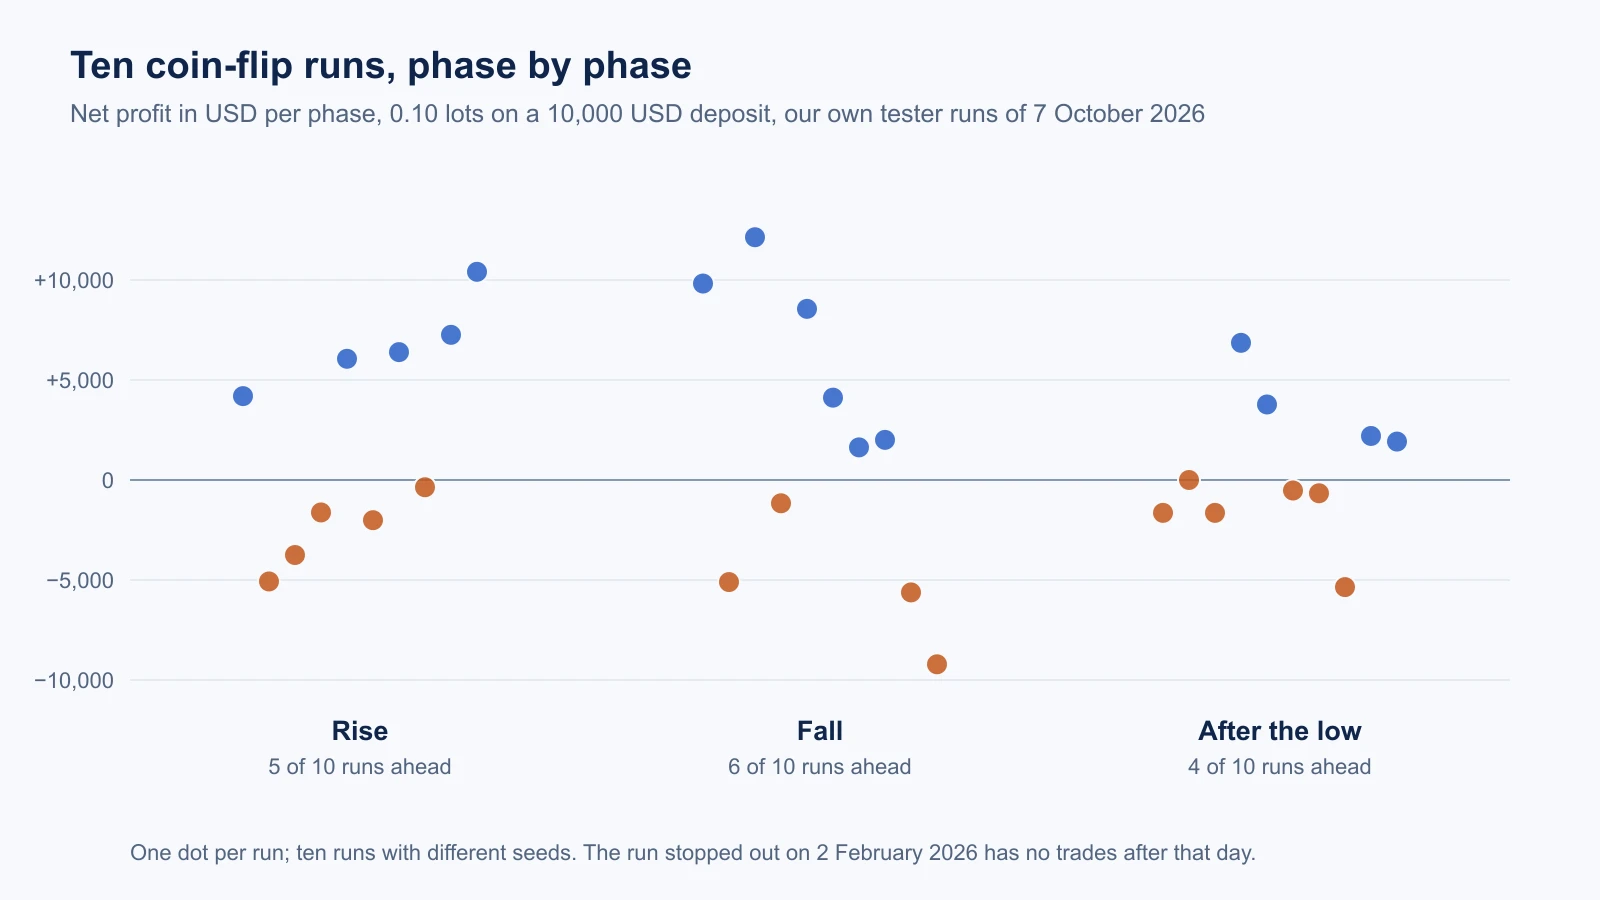
- In the rise, five of the ten runs were ahead. In the fall, six. After the low, four.
- Only one run, the one with seed 5, was ahead in all three phases. The seed is the number that starts the random sequence and has no meaning for the market.
- Two of the five runs that were ahead in the rise lost 5,620 and 9,214 USD in the fall. The run that gained most in the fall (+12,139 USD) had lost 3,750 USD in the rise.
- One run was stopped out on 2 February 2026, a few days after the high, and took no further trades. It is the dot at zero in the last phase.
The runs have no edge, so each phase is a draw from the same wide distribution. That is the point: a phase result of a few thousand USD on 10 ounces of gold is within the range of luck. A good phase tells you little. A bad phase of a rule that is meant to work in every regime tells you more.
How to split your gold EA backtest into phases
You do not need our data for this. You need the deal list or the equity curve of your own backtest and a price chart of the same period.
- Mark the turning points. Find the highest and the lowest price of the test period, and the larger swings in between. Write down the dates before you look at the EA’s result.
- Get the result per phase. The MT5 report prints one total. You can add the deals per date range from the deal list, or run the same settings in the Strategy Tester with the date range of each phase. Our guide on reading an MT5 Strategy Tester report shows where each figure stands. The date range is an input of the tester (MetaQuotes help).
- Look at the largest equity drawdown in each phase, not only the profit. A phase can end flat and still have taken the account down 40% on the way.
- Split long and short. If almost all profit in the rise comes from long positions, the EA was long in a rising market. In our breakout test on gold the same pattern showed up between buys and sells.
- Set the loss in the worst phase against your deposit and your limit, and ask whether you could have held the account through it. For a grid or an averaging EA, use the largest total volume it had open, as our guide on grid trading and martingale explains.
- Compare with the benchmarks per phase. Run the buy-and-hold rule and a few coin flips of the benchmark EA over the same phases and the same lot size. An EA that loses in the fall while the sell rule earned 9,122 USD has something to explain.
A good answer is not “profit in every phase”. Phases of 53 trading days are short. A good answer is a loss in the worst phase that is small against the deposit, a reason that fits the rules, and a result that is not just one direction. If the seller cannot show the result for a period in which gold fell, ask for it.
What we did not test
- We tested no gold EA from any seller, and we name none.
- We show no result of our own products in this guide. The numbers come from four teaching rules.
- The phases are cut at the high and the low of the 20:00 prices on our demo server. Another broker has other prices and could give other dates.
- The tests used “1 minute OHLC” and not real ticks. For rules that act once at a fixed hour the difference should be small; we did not measure it.
- The test period holds one long rise, one fall of 119 trading days and one short phase of 53. Another period will give other numbers, and 53 days is too short to draw a conclusion from.
- We do not explain why gold fell. The guide describes the price our test used and what simple rules did on it.
Frequently asked questions
Does my gold EA survive a fall in the gold price?
Only a test over a falling stretch can tell you, and a single total does not show it. In our test a rule that bought every day lost 9,445 USD in the 119 trading days after the record, with 0.10 lots on 10,000 USD. Split your backtest into phases and read the worst one.
What is a regime change in trading?
It is a change in how the market behaves, for example from a steady rise to a fall or a range. Rules built for one regime can lose in the next. A regime change is easy to see in hindsight and hard to see as it happens.
Why do gold EA backtests look so good?
Many gold backtests run over years in which gold rose, and a rule with a long bias collects that rise. In our test the same buying rule that made +4,522 USD in the rise lost 9,445 USD in the fall. Our benchmark guide shows that even a coin flip produced a profit in eight of ten runs.
Should I tune my EA on the fall?
No. Settings chosen because they handled one fall best are a fit to that fall. Use the phases to look at behaviour, then keep a later period that the EA has never seen for a final check, as described in our curve-fitting guide.
Can I use phases to pick the best gold EA?
Not on their own. A phase result of a few thousand USD is within the range that coin-flip runs reach on the same prices. Phases help you to find out what an EA depends on, not to rank it.

Sources & further reading
Your next question