Learn
Best Gold EA? Benchmark It Against Buy-and-Hold and a Coin Flip
At a glance
Before you judge a gold EA, an Expert Advisor that trades XAUUSD, compare its backtest with three benchmarks on the same XAUUSD period and lot size: buying once and holding, the result split into long and short positions, and a coin flip. In our MT5 backtest from January 2024 to September 2026, gold doubled and holding 0.10 lots made 15,534 USD on a 10,000 USD deposit. Buying every day from 10:00 to 20:00 lost 3,409 USD. Of ten coin-flip runs, eight ended with a profit; the best made 18,393 USD with a profit factor of 1.24. In 10,000 further coin-flip sequences, 44% ended with a profit and 35% lost the whole deposit.
On this page

Gold dominates the front of the MQL5 Market. On 7 October 2026 we counted the first 210 Expert Advisors listed for MetaTrader 5: 129 of them name gold or XAU in the title or the first lines of the description.
There is a reason the backtests look good. In the price history we tested on, an ounce of gold cost 2,065 USD at the start of 2024 and 4,182 USD at the end of September 2026. A backtest over that period has the market behind it, and gold moves far enough each day for luck to produce large numbers.
This guide gives you three benchmarks. We ran them ourselves with a small Expert Advisor that has no trading idea at all. You can download it and run it on your own broker’s prices.
Disclosure: RoboXpert develops trading software and has a commercial interest in this subject. The tests ran on 7 October 2026 in MetaTrader 5 build 6230 on a demo server. They are backtests of four teaching rules. They are not a forecast and not a recommendation to buy, sell or hold gold. AI assisted with research, calculation and drafting. See our editorial methodology.
What the gold price did in the test period
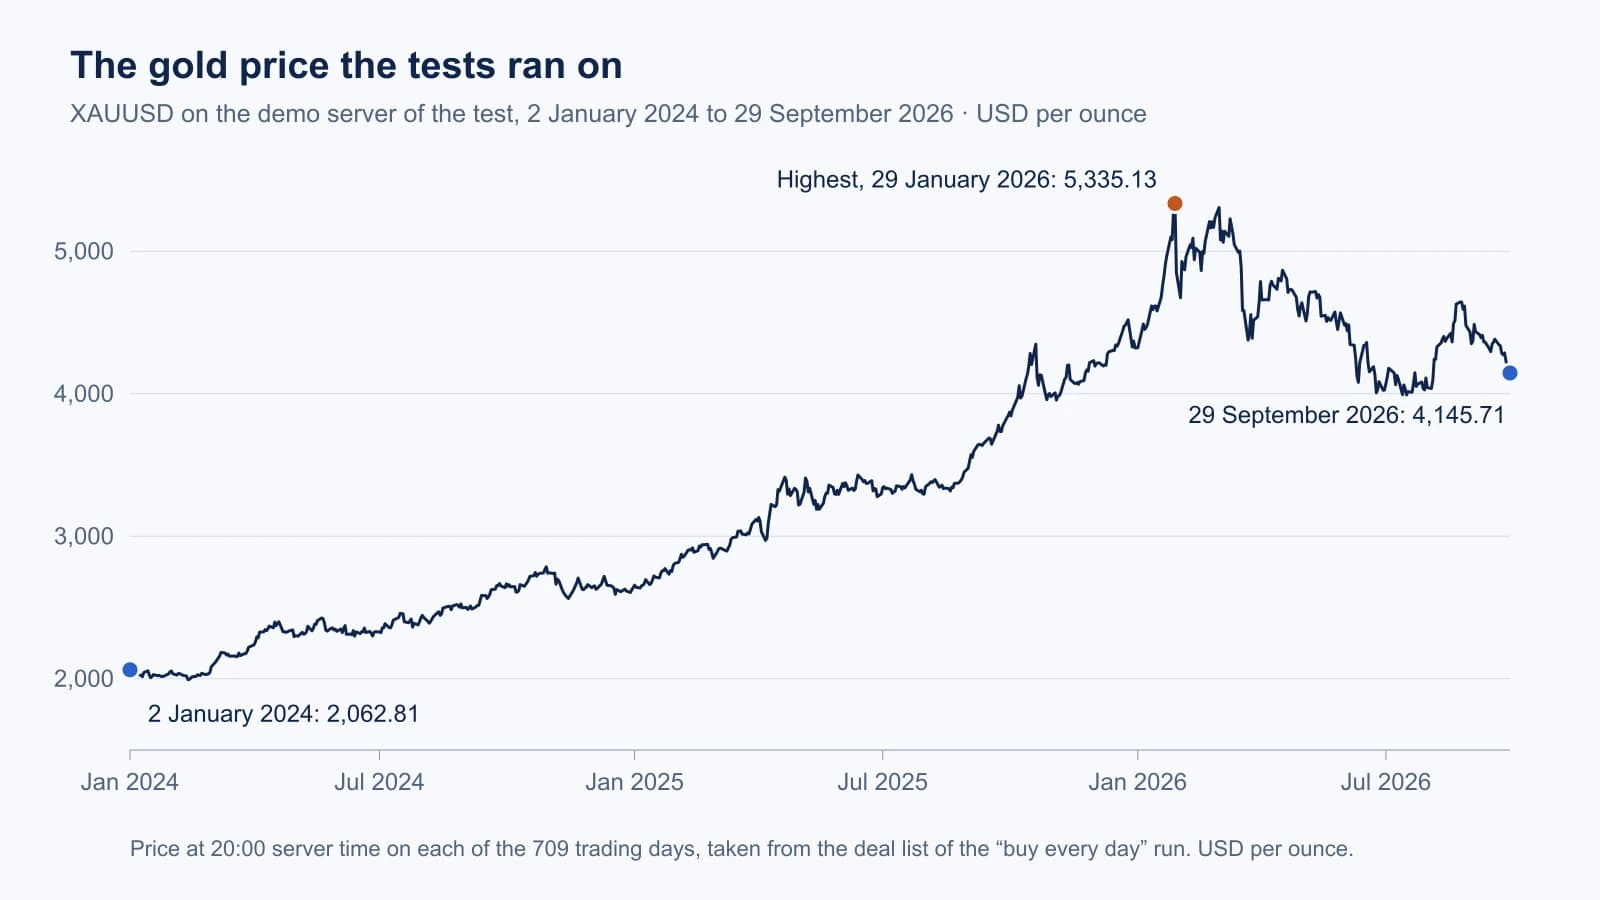
The test settings, as the reports print them:
Scroll horizontally if needed
| Setting | Value |
|---|---|
| Symbol and timeframe | XAUUSD, H1 |
| Period | 1 January 2024 to 30 September 2026 |
| Test mode | 1 minute OHLC, History Quality 99% |
| Deposit and leverage | 10,000 USD, 1:500 |
| Position size | 0.10 lots, which is 10 ounces |
| Server | Demo server of Capital Point Trading Ltd |
The mode “1 minute OHLC” uses four prices per minute. That is enough here, because the rules open and close at fixed hours and use no stop. Our glossary explains the test modes.
Four rules without a trading idea on XAUUSD
The Expert Advisor has one input that selects the rule:
- Buy once and hold. Buy 0.10 lots on the first tick and never close.
- Buy every day. Buy at 10:00 server time, close at 20:00.
- Sell every day. Sell at 10:00, close at 20:00.
- Coin flip every day. Open at 10:00, close at 20:00. A random number decides between buy and sell.
None of them looks at a chart, an indicator or the news.
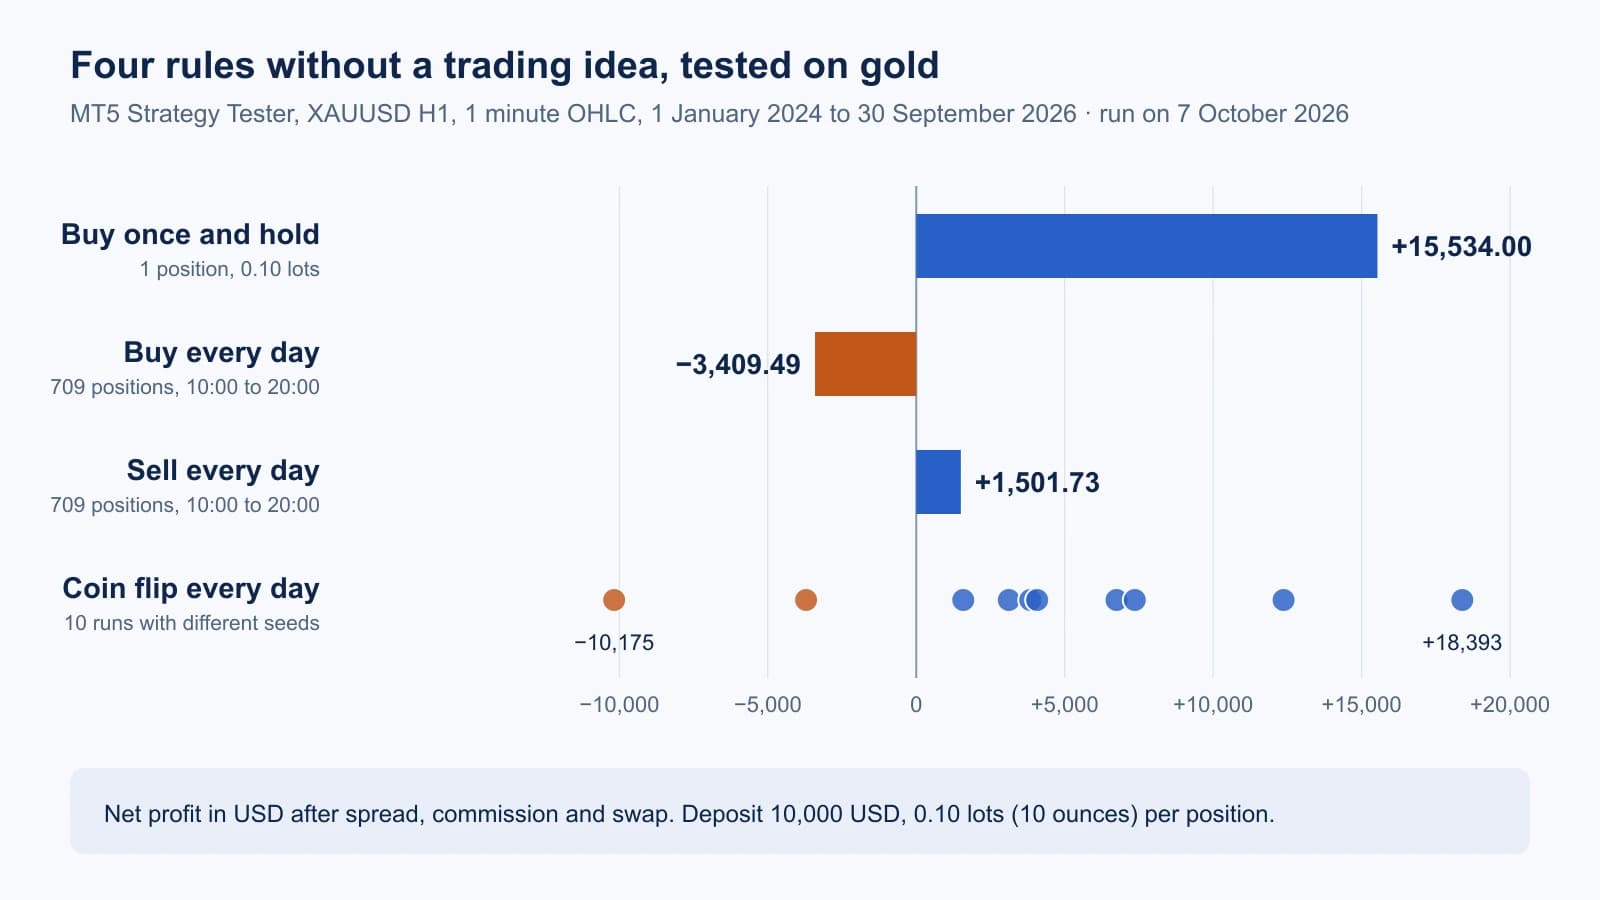
The table gives the result of each rule and the largest fall of the account on the way:
Scroll horizontally if needed
| Rule | Positions | Net profit | Largest equity drawdown |
|---|---|---|---|
| Buy once and hold | 1 | +15,534.00 USD | 42.38% |
| Buy every day, 10:00 to 20:00 | 709 | −3,409.49 USD | 88.31% |
| Sell every day, 10:00 to 20:00 | 709 | +1,501.73 USD | 94.30% |
| Coin flip every day, ten runs | 709 each, one run stopped at 539 | −10,175.49 to +18,393.19 USD | 27.28% to 101.97% |
Holding made 155% on the deposit. The price gain of 10 ounces was 21,168.90 USD. Swap took 5,634.20 USD of it, about a quarter. Holding gold through a broker’s XAUUSD contract costs money every night. On the way the position lost 17,396.69 USD from its high.
Buying every day lost money while gold doubled. This is the result we did not expect. The rise did not happen between 10:00 and 20:00 server time. Added up over all 709 days, gold fell by 289.63 USD per ounce inside that window and rose by 2,361.98 USD outside it:
Scroll horizontally if needed
| Year | Move from 10:00 to 20:00 | Move from 20:00 to 10:00 the next day |
|---|---|---|
| 2024 | +78.62 | +472.20 |
| 2025 | +455.40 | +1,242.41 |
| 2026, to 29 September | −823.65 | +647.37 |
| Total | −289.63 | +2,361.98 |
Prices in USD per ounce, from the 10:00 and 20:00 deals of our run. A rising market helps only the positions that are open while it rises. A benchmark must hold positions at the times the Expert Advisor holds them.
Both daily rules nearly lost the account on the way. The buyer’s equity fell by 88% at its worst point and the seller’s by 94%, with 0.10 lots on 10,000 USD.
A coin flip with a profit factor of 1.24
We ran the coin flip ten times with ten different seeds for the random numbers. Eight runs ended with a profit. This is the Results block of the best one, exactly as MetaTrader saved it:
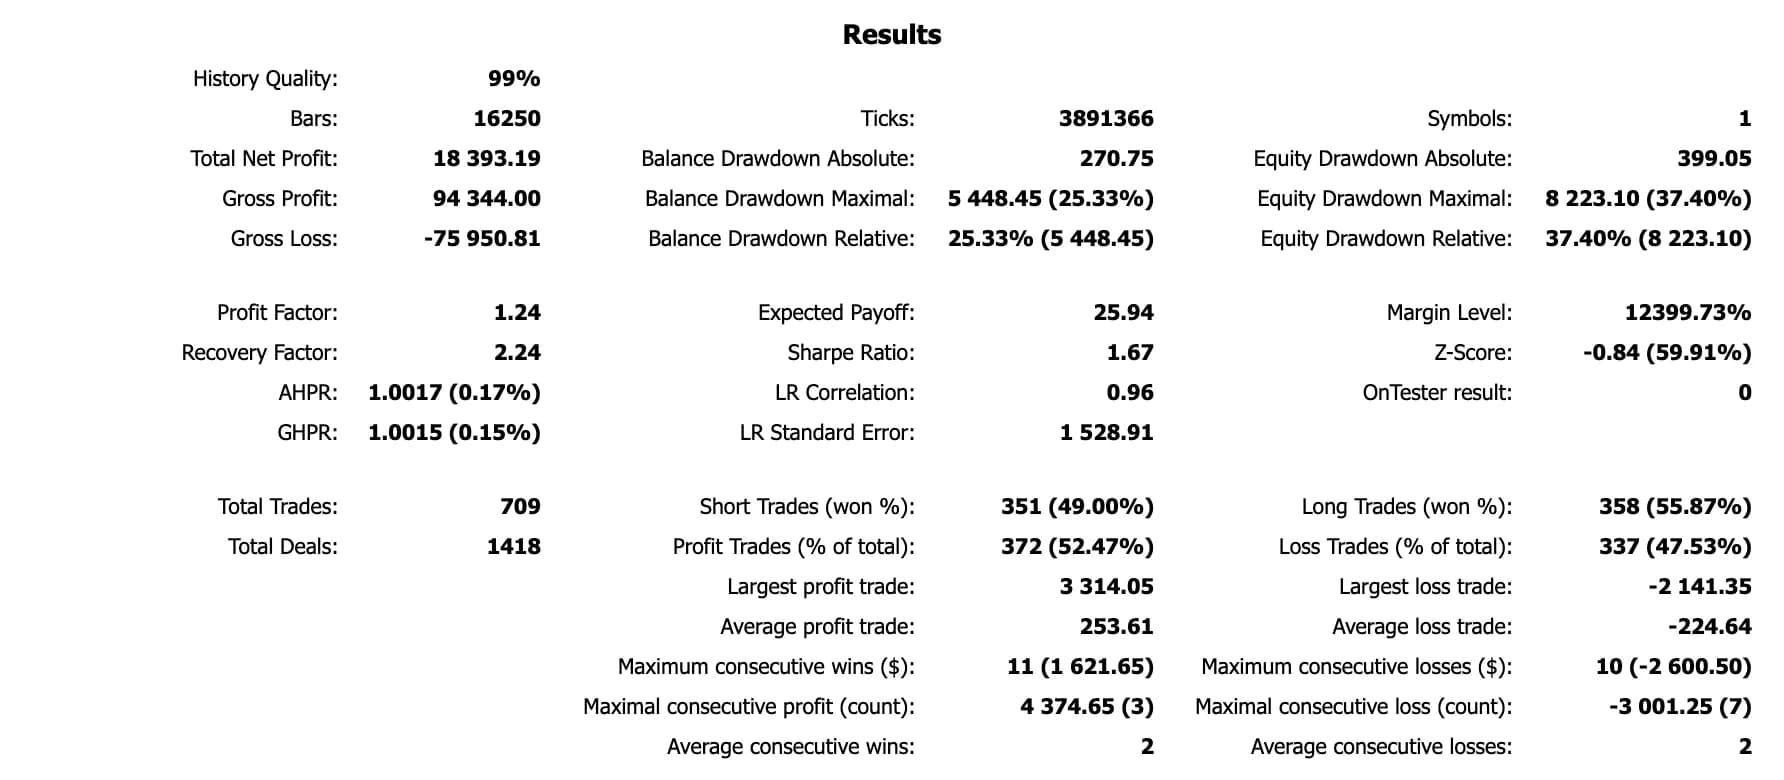
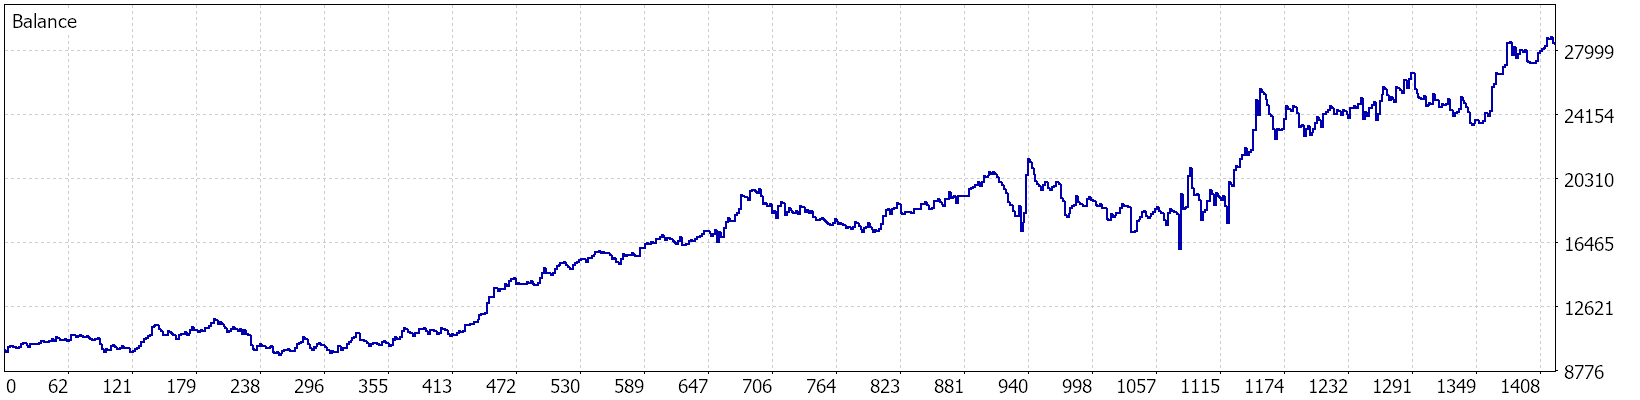
Net profit of 18,393.19 USD on a 10,000 USD deposit, 709 trades, profit factor 1.24, Sharpe ratio 1.67, a balance line that the report rates with an LR Correlation of 0.96. On a product page this would pass as a strong gold backtest. It beat buying and holding. Its only “strategy” is the seed number 5.
Every figure in this report is correct. Our guide on reading an MT5 Strategy Tester report explains each line. What the report cannot show is how many other runs stand behind the one you are looking at.
How often a coin flip wins on gold
Ten runs are a small sample, so we checked the result a second way. A coin-flip run is nothing but a choice, on each of the 709 days, between that day’s long result and that day’s short result. Both are in the deal lists of the two fixed runs. We rebuilt the nine complete coin-flip runs from these lists, and all nine match their tester reports to the cent. Then we drew 10,000 more sequences the same way.
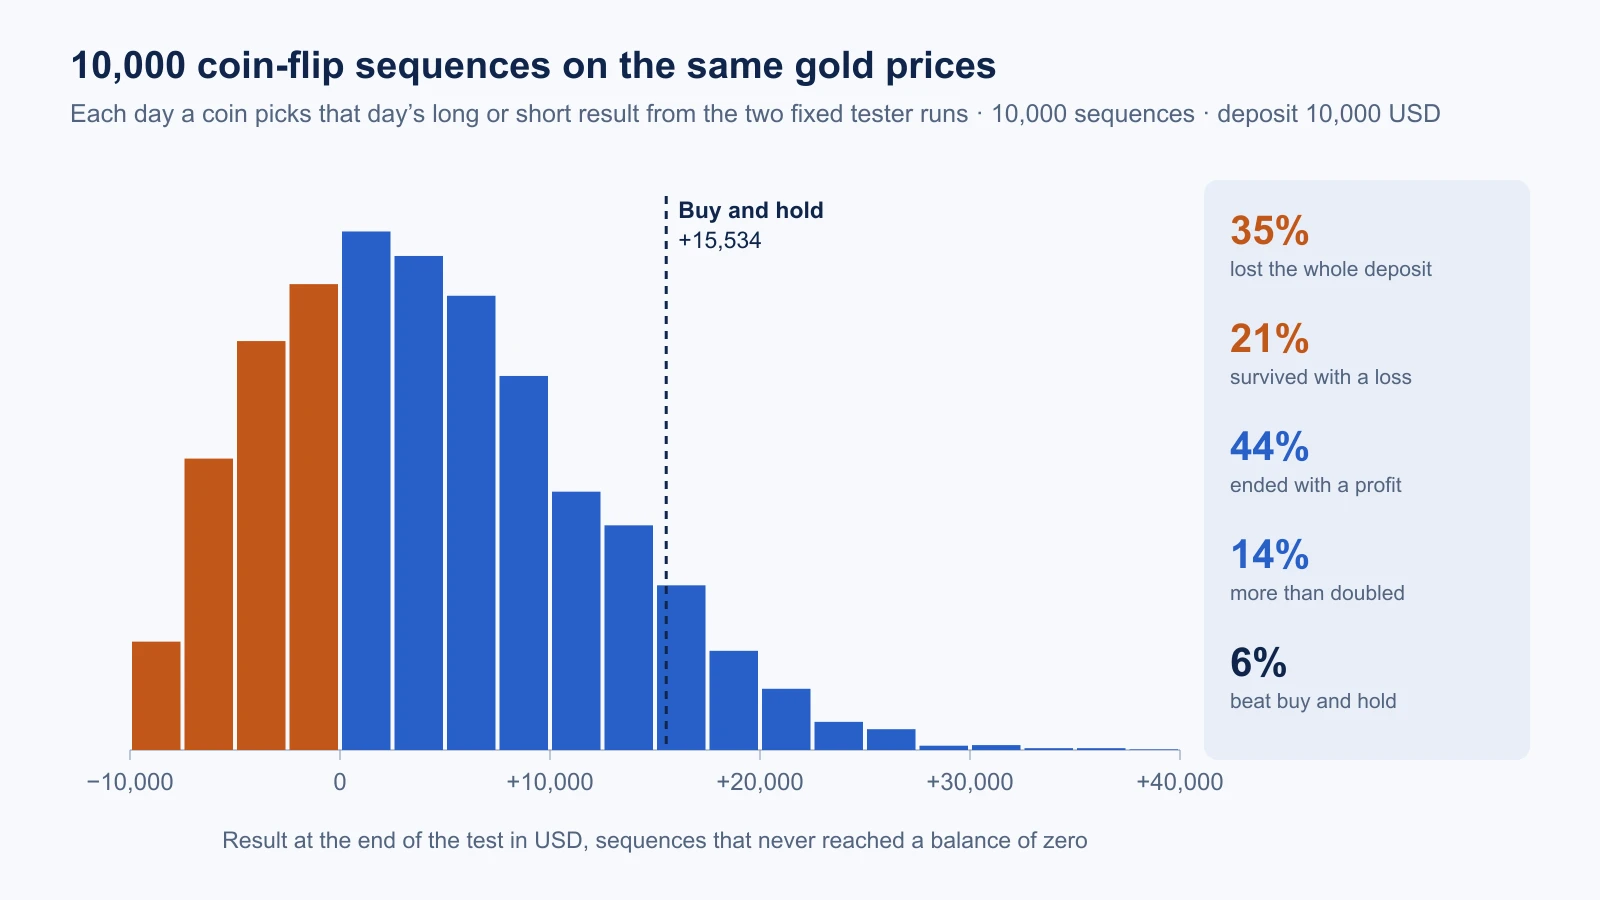
The table counts the sequences by how they ended; the last three rows are part of the 4,429 that ended with a profit:
Scroll horizontally if needed
| Outcome of 10,000 coin-flip sequences | Sequences | Share |
|---|---|---|
| Balance reached zero on the way | 3,489 | 35% |
| Survived and ended with a loss | 2,082 | 21% |
| Ended with a profit | 4,429 | 44% |
| Ended more than 5,000 USD up | 2,775 | 28% |
| More than doubled the deposit | 1,422 | 14% |
| Beat buy-and-hold | 571 | 6% |
The average result of all sequences is −953.88 USD. That is the cost of 709 round trips: 496.30 USD commission, about 455 USD spread and a few dollars of swap. The coin has no edge, and the costs make the expected result negative. Still, more than one sequence in four ends at least 50% up, and one in seven doubles the account.
The reason is the size of the daily move. With 10 ounces, a day on which gold moves 40 USD is a result of 400 USD in either direction, which is 4% of the deposit. Over 709 days these swings add up: the end results have a standard deviation of about 10,000 USD around the average.
Three benchmarks for a gold EA backtest
Take the backtest you are shown, or the demo of the product in your own Strategy Tester, and note its period, deposit and lot size. Then compare.
1. Buy-and-hold with the same size. Run rule 1 of the benchmark EA over the same period with the lot size the product uses. A gold EA that made 80% from 2024 to 2026 with 0.10 lots per 10,000 USD made about half of what holding made, with whatever drawdown it had on top. For a grid, use the largest total volume it had open, because that is the position it asked you to carry.
2. Long and short separately. The report prints “Long Trades (won %)” and “Short Trades (won %)”. It does not print the profit of each side. Our script adds it up from the deal list. If nearly all profit comes from long positions in a period when gold doubled, the test shows that the EA was long. It does not show that its entries were good. One example from our own runs: the Moving Average EA that ships with MetaTrader closed 720 trades on the same gold data. Its long positions made 7,095.49 USD and its short positions lost 11,890.42 USD. Ask for a test over a falling period: on our server gold fell from 5,335 to 3,992 USD between 29 January and 16 July 2026. Our ten-year test of the previous-day breakout on gold shows the same pattern: from September 2022 its buys earned 82 R and its sells lost 22 R.
3. The coin flip with the same size and holding time. Run rule 4 with a few seeds, the product’s lot size and roughly its holding time. You then know how wide results are when the entries carry no information. A profit inside that range is no evidence. The width grows with the lot size: at 0.20 lots every number in the table above doubles, and far more accounts are lost.
A result that is clearly better than all three, over a period with a rise and a fall, is worth a closer look. The next steps are the same as for any Expert Advisor: real ticks, costs, a forward period and a verified account. Our guide on whether Expert Advisors work explains why one good record among many candidates proves little.
Download the benchmark EA (ZIP). Source code of the benchmark Expert Advisor, the original MT5 report of the best coin-flip run, the scripts and the figures of all 13 runs. No account data.
The download contains the source code of the benchmark EA. Compile it in MetaEditor, select it in the Strategy Tester and choose the rule in the inputs. It is a measuring tool. Do not attach it to a live account.
What gold costs per 0.01 lot
The figures are from the symbol specification of our test server and from the tester runs. Check them on your own account, because brokers differ.
Scroll horizontally if needed
| Item | On our test server |
|---|---|
| Contract size | 100 ounces per lot, so 0.01 lot is 1 ounce |
| A move of 1 USD in the gold price | 1 USD per 0.01 lot |
| Swap for a long position | −0.56 USD per night and 0.01 lot, three times on Wednesday |
| Swap for a short position | +0.39 USD per night and 0.01 lot |
| Commission | 0.07 USD per round trip of 0.01 lot |
| Spread at 10:00 and 20:00 | 0.064 USD on average |
| Margin for 0.01 lot at a price of 2,063 USD | 4.13 USD at leverage 1:500 |
The margin is the trap. At 1:500 and a price of 2,063 USD, the 10,000 USD of our test were enough margin for about 24 lots, 240 times the position we tested. From its high on 29 January 2026 to its low on 16 July, gold fell by 1,343 USD per ounce at the 20:00 prices. One ounce held through that fall lost 1,343 USD. A grid that had added to 0.50 lots on the way down, to take one example, would have been carrying 50 ounces. Our guide on grid trading and martingale shows how such positions build up, and the one on lot size and capital how to size them.
What we did not test
- We tested no gold Expert Advisor from any seller, and we name none. The guide is about the benchmark, and the conclusion about a product is yours to draw from your own test.
- The tests ran in the mode “1 minute OHLC” on one demo server. The download of real ticks for XAUUSD was cancelled by the terminal, so we have no real-tick run. For rules that act once at a fixed hour the difference should be small; we did not measure it.
- Leverage was 1:500, as the reports print it. We did not repeat the gold runs at another leverage.
- The window from 10:00 to 20:00 is server time. On another broker the same hours can cover another part of the day.
- The 10,000 sequences are a calculation from tester results. They ignore the stop-out level, as the note above explains.
- The period contains one long rise and one fall. Benchmarks over another period will give other numbers. That is the reason to run them yourself.
Frequently asked questions
What is the best gold EA?
We cannot name one, and a ranking without own tests of each product would be worth nothing. What you can do is test a candidate against the three benchmarks above. In our backtest a coin flip produced a report with a net profit of 18,393 USD on 10,000 USD, so a good-looking gold backtest alone does not identify a good EA.
Why do so many gold EAs show profitable backtests?
Two reasons that have nothing to do with the quality of an EA. Gold roughly doubled between January 2024 and September 2026 in the price history we tested on, which helps every strategy that is mostly long. And gold moves far each day, so even random entries produce large profits in a good share of runs: 44% of our 10,000 coin-flip sequences ended with a profit.
Is a gold EA better than just buying gold?
Compare them over the same period and position size. In our test, holding 0.10 lots from January 2024 to September 2026 made 15,534 USD after 5,634 USD of swap, with a drawdown of 42%. An EA has to be judged against that, including its own drawdown.
How much money do I need for a gold EA with 0.01 lots?
There is no fixed amount. On our test server 0.01 lot is one ounce, so each dollar the gold price moves is one dollar. Work out what a fall or rise of several hundred dollars means for all positions the EA can have open together, and compare that amount with your deposit. The margin requirement is far too small to be a guide.
Can I use the benchmark EA to trade?
No. The two daily rules lost about 90% of the account at some point in our test, and the coin flip lost it completely in one run of ten. Use it in the Strategy Tester to measure what a period and a lot size produce without any trading idea.

Sources & further reading
Your next question