Learn
Previous Day High/Low Breakout on Gold: Ten Years Tested, With and Without a Rally
At a glance
The previous day high low breakout on gold places a buy stop at yesterday's high and a sell stop at yesterday's low. We simulated a plain version on XAUUSD from January 2016 to October 2026, 2,350 trades, with a stop at the middle of the previous day's range and costs of 0.60 USD per ounce per trade. Held to the end of the day, it lost 33 to 128 R from 2016 to 2021 and gained 50 R from 2023 to October 2026. It lost in all three years in which gold moved less than 5%, and from September 2022 the buys earned +82 R while the sells lost 22 R. With a 1R target, about half the trades won and the rule still lost in every year from 2016 to 2022. These are hypothetical simulations, not live results.
On this page

The previous day high/low breakout is one of the simplest rules for an Expert Advisor: if price breaks yesterday's high, buy; if it breaks yesterday's low, sell. On gold it is popular, and for the last three years it looked excellent, because gold kept rising.
The question this guide answers is the one a backtest from those three years cannot: what does the rule do when gold does not rally? We tested a plain version over ten years, through flat years, falling years and the rally of 2023 to 2026.
Disclosure and method: All results here are hypothetical simulations on historical prices, not live trading and not a test of any product. The rule is our own published reference rule, written for this guide. RoboXpert sells Daybreak, an EA that trades its own version of this breakout, so we have a commercial interest in the subject; Daybreak's settings are not used or revealed here. Simulated on 31 October 2026. AI assisted with coding and drafting. See our editorial methodology.
The previous day high low breakout rule we tested
We kept the rule as plain as possible, so that every result can be traced to one of its parts. It trades at most once per day.
- Levels: the previous day's high and low, with days counted in server time UTC+2/+3, the clock most gold brokers use.
- Orders: from the start of the new day, a buy stop waits at the high and a sell stop at the low. The first one filled cancels the other.
- Stop-loss: the middle of the previous day's range, so the risk is half the range.
- Exit: in the main variant, at the end of the day. In a second variant, also at a target of 1R, the same distance as the risk.
- Costs: 0.30 USD per ounce for the spread on every trade, plus 0.30 for slippage in the main scenario.
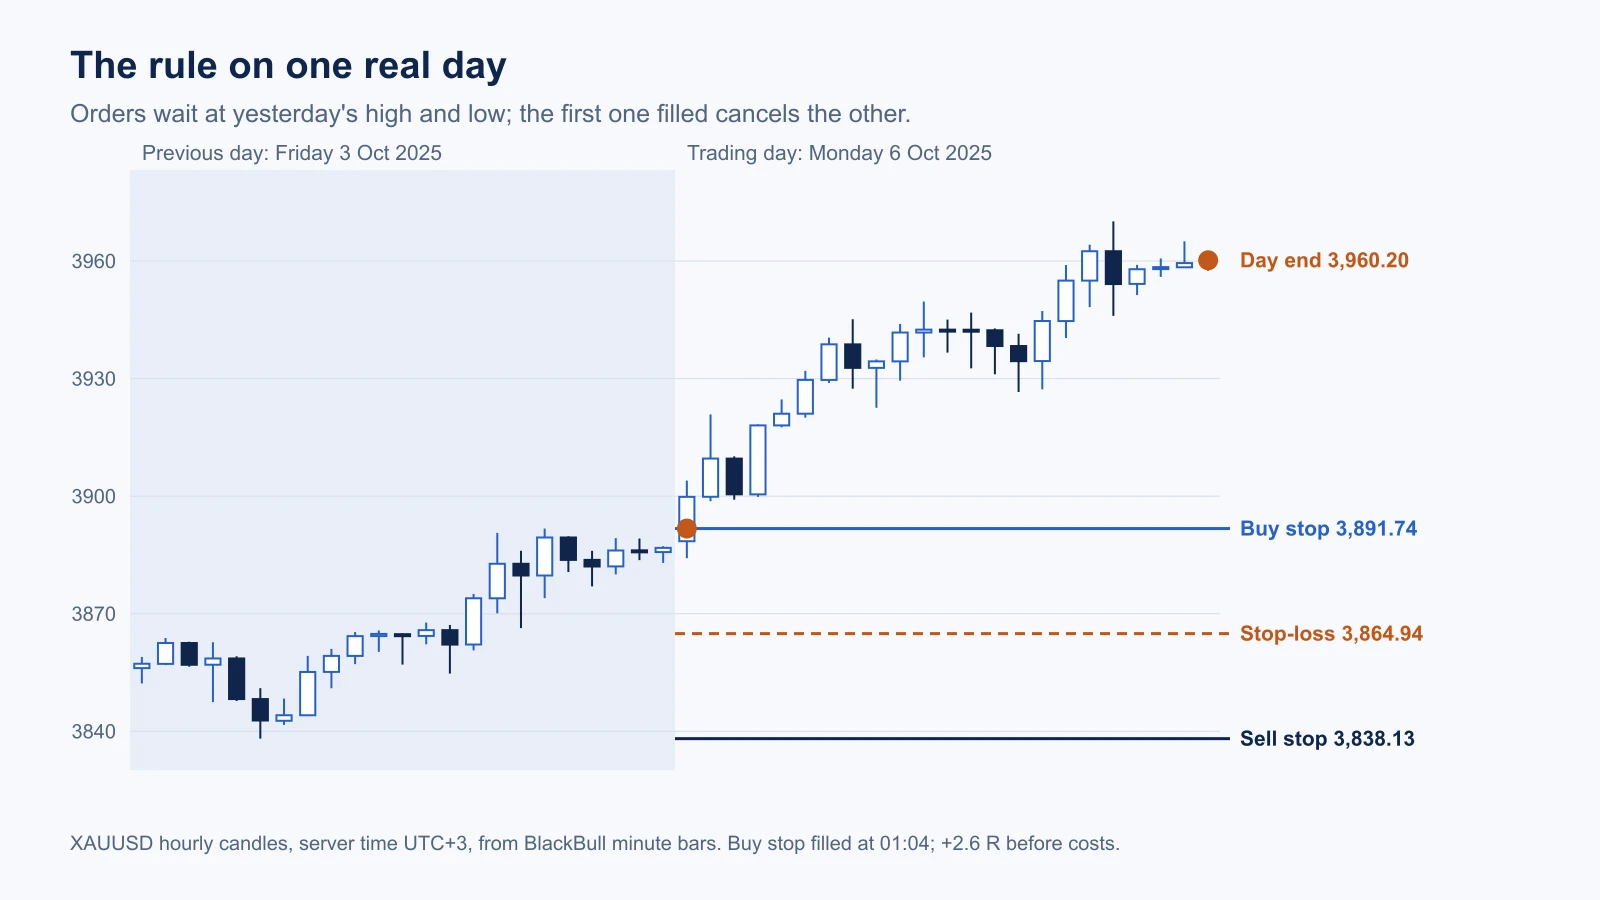
Results are in R: the profit or loss of a trade divided by its initial risk. A trade that hits its stop loses 1R plus costs. R makes years comparable even though gold cost 1,100 USD in 2016 and over 4,000 USD in 2026.
Previous-day breakout results year by year
The chart shows the main variant, held to the end of the day, after spread and slippage. Under each year stands how much gold itself rose or fell, from the first to the last price of that year.
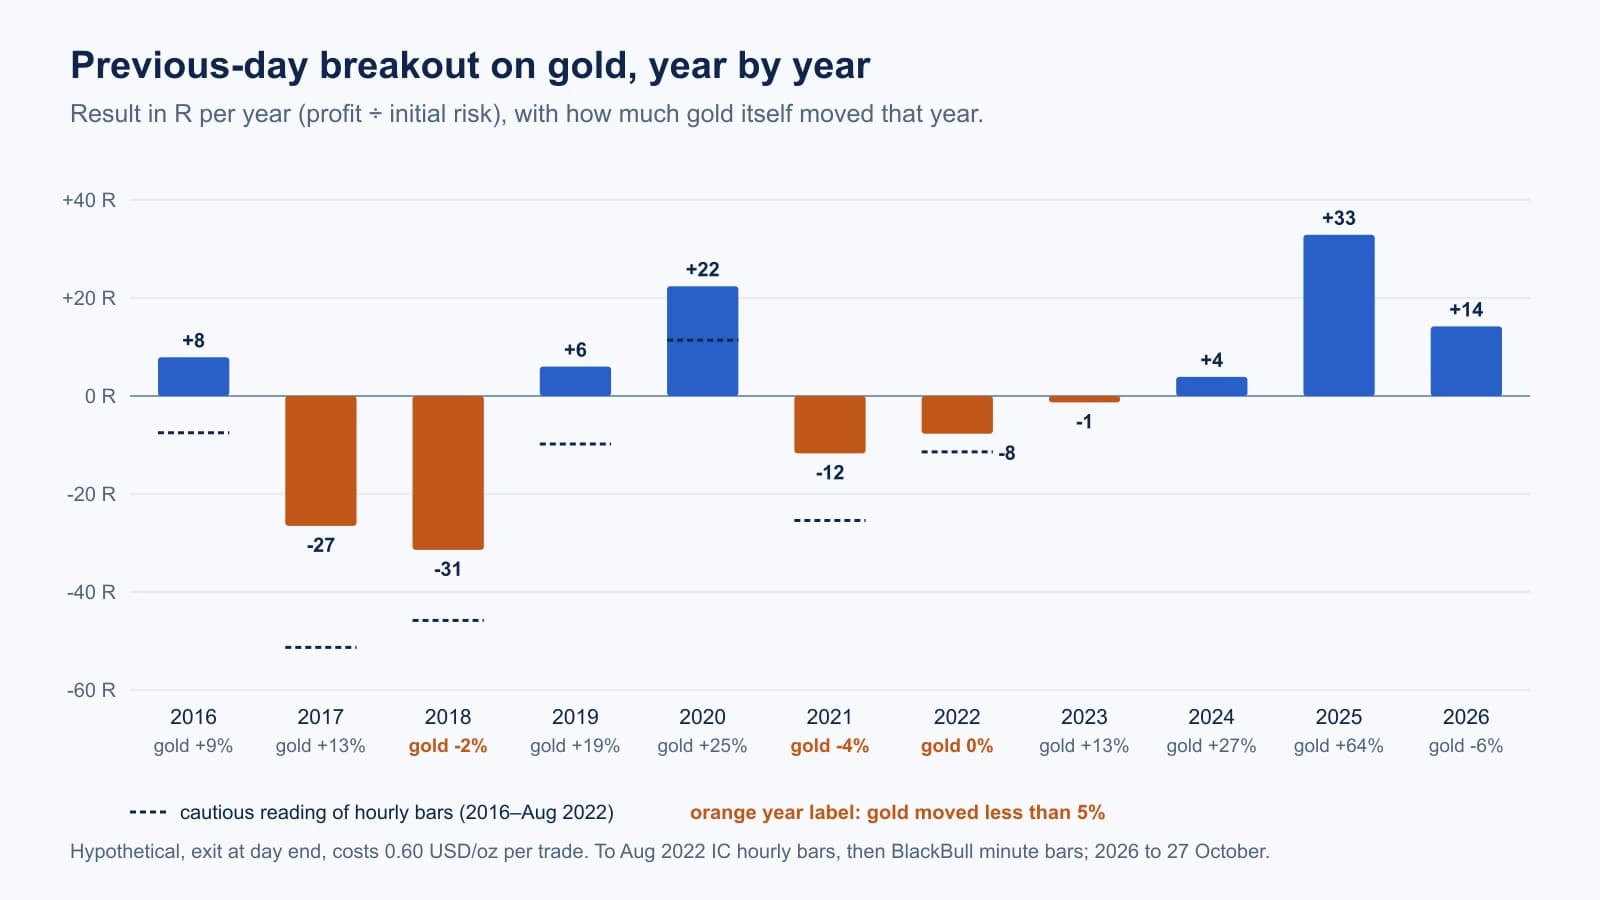
The totals for both variants and both cost scenarios are below. For 2016 to 2021, the first number uses the reading of hourly bars that matched the minute data best and the second the cautious one; the section on how we tested explains why there are two.
Scroll horizontally if needed
| Result in R | 2016–2021, hourly bars | 2023–Oct 2026, minute bars |
|---|---|---|
| Day-end exit, spread and slippage (0.60 USD) | −33 to −128 | +50 |
| Day-end exit, spread only (0.30 USD) | +24 to −71 | +66 |
| 1R target, spread and slippage | −114 to −208 | +20 |
| 1R target, spread only | −56 to −151 | +37 |
In the first six years the rule lost under every combination except one: the optimistic reading with spread only. From 2023 it gained under all of them. That split matches the price of gold more closely than any part of the rule.
Does a gold breakout strategy need a rally?
In this form, yes, and even a rally is not enough. Three of the ten full years were flat, with gold moving less than 5% from January to December: 2018, 2021 and 2022. The rule lost in all three, by 31, 12 and 8 R in the main variant.
The rally years are mixed. 2020 (+25%) and 2025 (+64%) were the two best years, but 2017 (+13%) lost 27 R and 2024 (+27%) gained only 4 R. A breakout rule needs days that keep going in one direction after they break yesterday's level, and a rising year can still consist of many days that do not.
Where the profit came from is clearest on the minute data from September 2022. The buy trades earned 82 R, the sell trades lost 22 R.
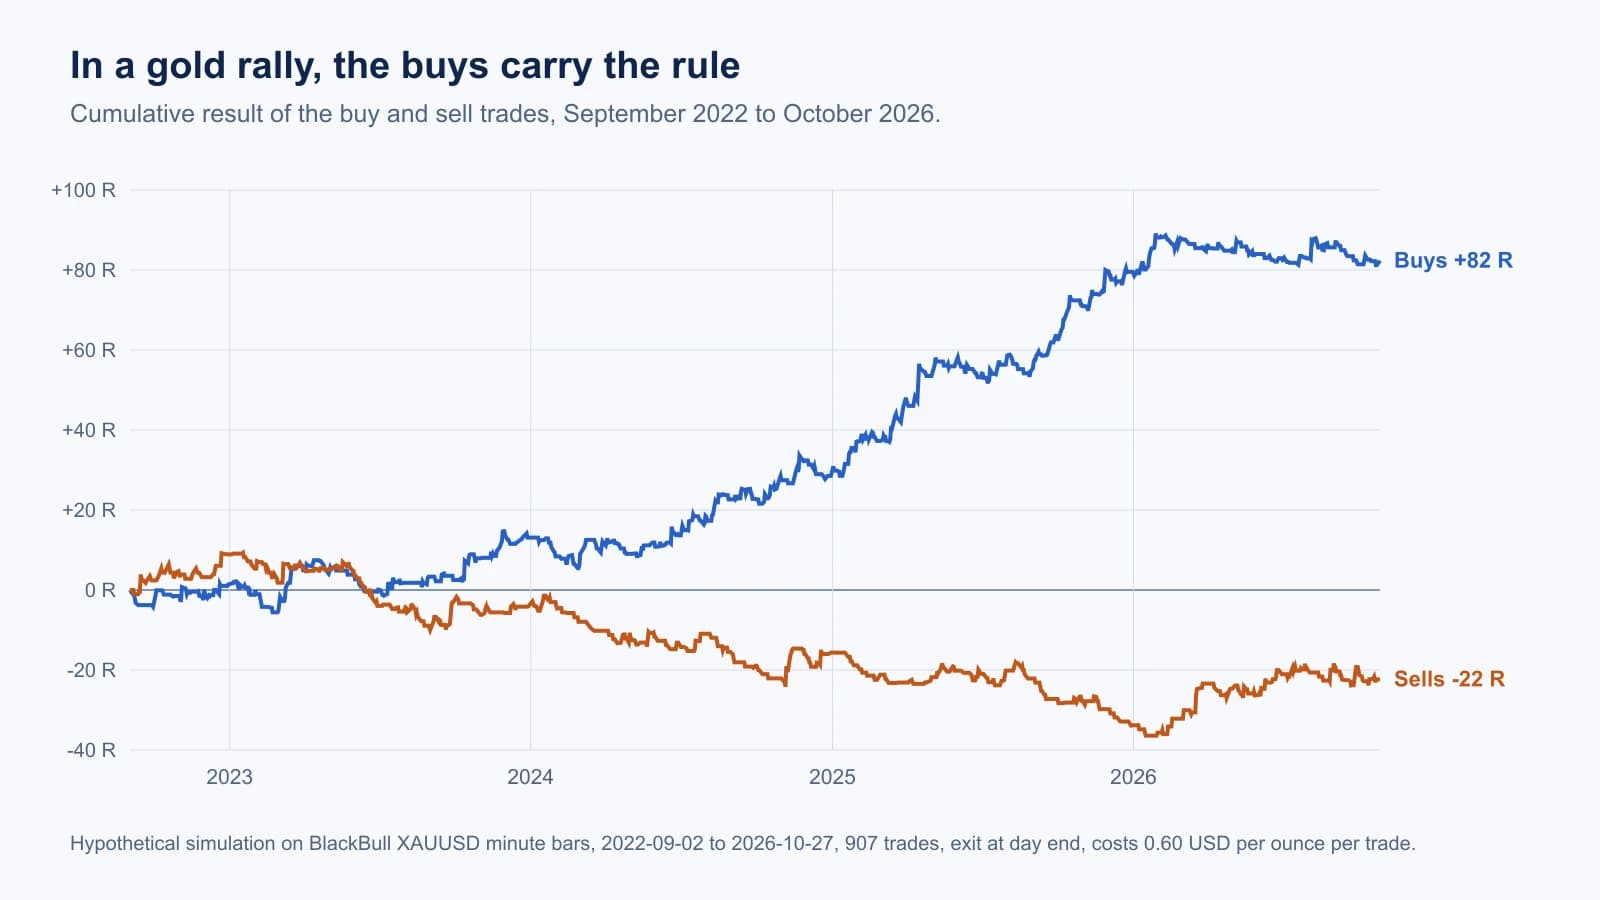
A rule that earns with buys during a rally is partly a long position in gold. That is not a flaw in itself, but it means a backtest from 2023 to 2026 says little about a year like 2018. Our gold benchmark guide shows how to compare any gold result with simply holding gold over the same period.
What is the success rate of the previous-day breakout?
The success rate people search for is the share of winning trades. In our test it depends on the exit more than on the year.
- With a 1R target, 47% to 49% of the trades won over the ten years, between 42% and 56% in single years. With a target as far away as the stop and costs on every trade, a win rate under about 52% loses money; the variant lost in every year from 2016 to 2022.
- With a day-end exit, only 40% to 42% won, but the winners were larger, because some days ran far beyond 1R. This variant came closer to breaking even.
A win rate alone tells you little. A rule can win most trades and lose money, or win a minority and earn; our article on whether a trading indicator can make you rich shows the arithmetic.
Why quiet years cost more
The costs per trade were the same every year: 0.30 or 0.60 USD per ounce. The risk per trade was not. In a quiet year the previous day's range is small, so the stop is close and the same costs take a larger share of every trade.
Scroll horizontally if needed
| Year | Median risk per trade (half the previous day's range) | 0.60 USD costs as share of the risk |
|---|---|---|
| 2017 | 5.68 USD per ounce | 11% |
| 2018 | 5.42 USD | 11% |
| 2021 | 10.06 USD | 6% |
| 2025 | 24.80 USD | 2.4% |
| 2026 to October | 48.74 USD | 1.2% |
Over about 215 trades a year, 11% of R per trade adds up to more than 20 R in costs alone. That is most of the loss in 2017 and 2018. A daily range breakout on gold is therefore far more sensitive to the broker's spread and to slippage in quiet markets than in busy ones; our guide to EA cost sensitivity measures the same effect on other strategies.
How we tested and what hourly bars hide
Minute data from our test symbols reaches back only to August 2022. For the years before, we used IC Trading's hourly gold bars from January 2016. Both are in server time UTC+2/+3; a broker with another clock has other daily highs and lows, as our guide to MT5 server time shows.
Hourly bars hide the order of events inside an hour. When one hour touches both the entry and the stop, or both the stop and the target, the bar does not say which came first. We ran two readings: a cautious one that always counts the stop first, and an optimistic one that counts the target first and does not stop out a trade in the hour it was opened.
To see which reading to trust, we ran both on hourly bars built from the minute data of September 2022 to October 2026, where the true order is known:
Scroll horizontally if needed
| Same trades, Sept 2022–Oct 2026 | Day-end exit | 1R target |
|---|---|---|
| Minute bars (the true order) | +60 R | +19 R |
| Hourly bars, optimistic reading | +67 R | +13 R |
| Hourly bars, cautious reading | +14 R | −42 R |
The optimistic reading came within 7 R of the minute result, the cautious one was 46 to 61 R too low. For 2016 to 2021 we therefore show the optimistic reading as the main figure and the cautious one as the lower end of the range. Both lose with slippage.
Other choices in the simulation: stop orders fill at their level, or at the opening price when the market gaps through it; there is no swap; one fixed spread for the whole period. The same problem of the order inside a bar is why MetaTrader's Strategy Tester offers tick modes finer than open prices or one-minute bars.
Download the simulation (ZIP). The Python script with the reference rule, the results file behind every number in this guide, and the script that draws the figures. No price data.
The download holds the simulation script with the rule as described above, the results file with every number in this guide, and the code for the figures. The price data is not included; the script says which format it expects.
Before you trade or buy a daily range breakout
If you trade this rule yourself or look at an EA built on it, ask for evidence the 2023 to 2026 rally cannot provide.
- A test that includes flat gold years, such as 2018 or 2021, with results shown year by year rather than as one total.
- Buys and sells reported separately. If the sells lose over years, the result rests on gold rising.
- Costs in proportion to the stop. Ask what share of the average stop the spread and slippage take, and test with a higher cost.
- The broker's server clock. The previous day's high and low move with it.
- A comparison with holding gold over the same period.
What we did not test
- Any refinement: entry offsets, trend filters, trailing stops, time filters or other markets. Each of them can change the result; we tested only the plain rule.
- Daybreak or any other product. The offer below refers to its own product page.
- Swap costs and live execution. Slippage is an assumption of 0.30 USD per ounce, not a measurement.
- Data before 2016 or from other brokers.
Frequently asked questions
Does the previous day high/low breakout work on gold? In our ten-year test of a plain version, not reliably. It gained from 2023 to October 2026, when gold rallied, and lost from 2016 to 2021 after slippage, including in every year in which gold moved less than 5%.
What is the success rate of a previous day breakout strategy? In our test, 47% to 49% of trades won with a 1R target and 40% to 42% with an exit at the end of the day. Neither number tells you whether the rule makes money; that depends on the size of the wins and on costs.
Is a gold breakout strategy better with buys only? From September 2022, the buys earned 82 R and the sells lost 22 R, so in that rally buys-only would have been better. Whether that holds in a falling gold market, these years cannot show.
Which stop-loss should a previous-day breakout use? We used the middle of the previous day's range. In quiet years that stop is small, so spread and slippage take over 10% of every trade; a test should show results in both quiet and busy years.

Sources & further reading
Your next question