Learn
How to Read an MT5 Strategy Tester Report
At a glance
To read an MT5 Strategy Tester report, start with History Quality and the number of trades, then read net profit, drawdown and profit factor in that order. Most figures are sums over the deal list at the end of the report: we recomputed 33 figures of a real report with 646 trades on EURUSD M15 from its 1,292 deals, and all 33 matched. In this report Gross Profit and Gross Loss already contain commission, the profit factor of 0.94 divides the two, the Recovery Factor uses the equity drawdown, and the balance graph counts deals, not dates. History Quality reads 18% real ticks, so most of this test ran on generated ticks.
On this page

An MT5 Strategy Tester report prints about fifty figures. This guide goes through a real one and shows where each figure comes from, which ones to read first and what the report leaves out.
The report is from our own backtest: the range-breakout Expert Advisor from our guide on building an MT5 EA with AI, tested on EURUSD M15 from 1 January 2024 to 30 September 2026. The strategy lost money. That makes it a useful example, because a losing report cannot be mistaken for an advertisement.
We did one thing most explanations skip. We took the deal list at the bottom of the report and recomputed the summary figures from it. 33 figures could be rebuilt from the deals, and all 33 match the report. The script and the original report are in the download.
Disclosure: RoboXpert develops trading software. The test ran on 2 October 2026 in MetaTrader 5 build 6230 on a demo server. The figures describe one backtest of one teaching example. They are not a forecast and not a recommendation. AI assisted with research, calculation and drafting. See our editorial methodology.
The MT5 Strategy Tester report in one picture
This is the “Results” block of the report, exactly as MetaTrader saved it. Every section below refers back to it.
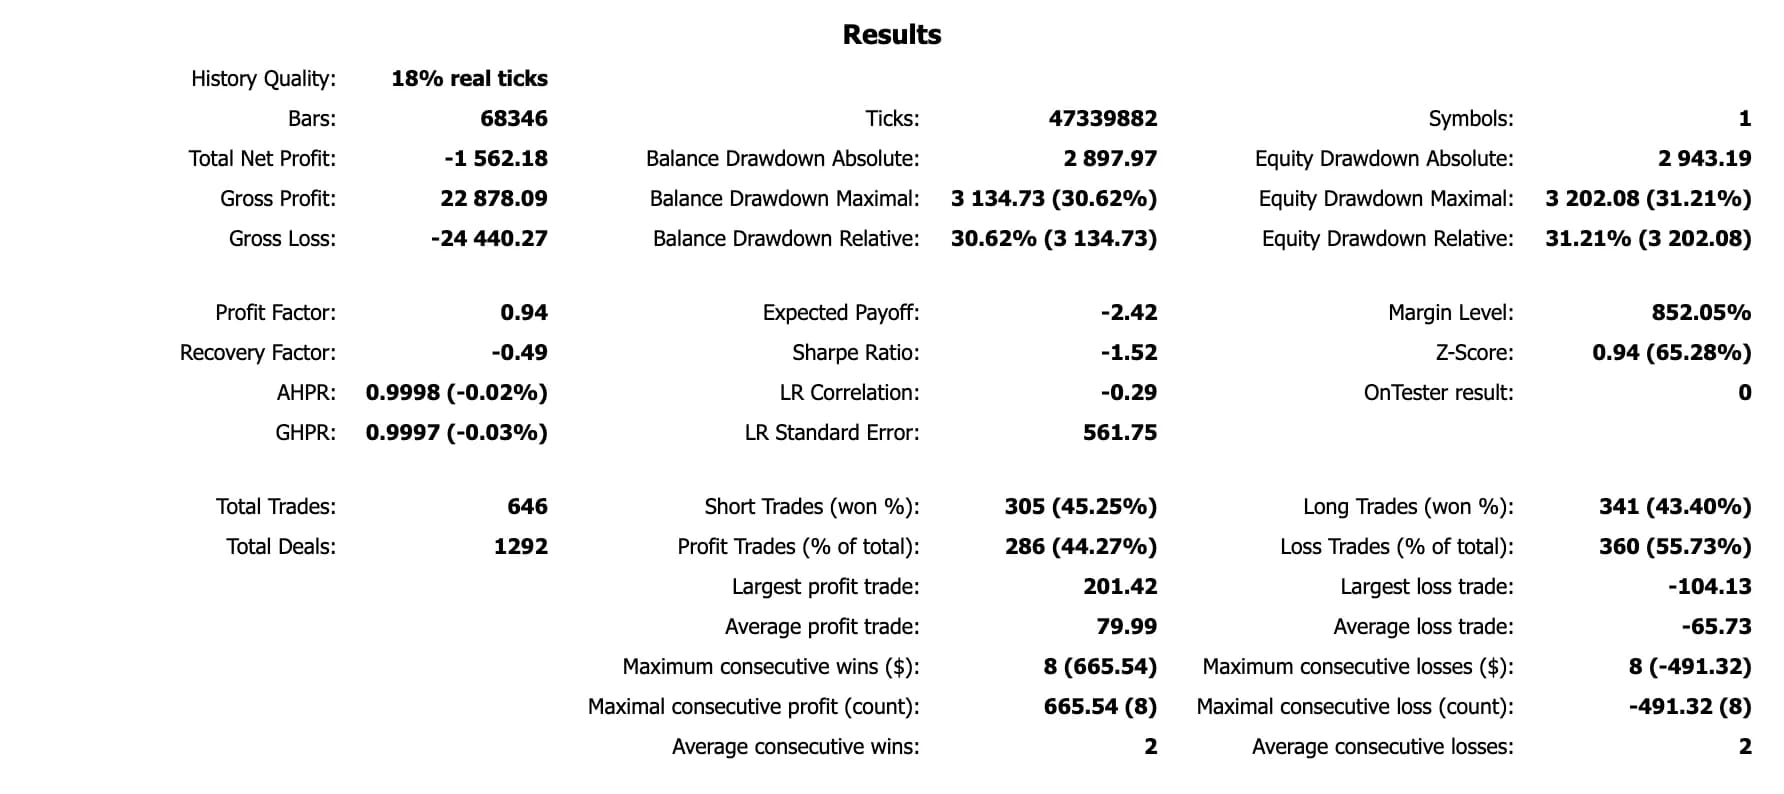
The table gives a reading order for the block and the question each step answers:
Scroll horizontally if needed
| Step | Lines | Question it answers |
|---|---|---|
| 1 | History Quality, Bars, Ticks | How much of the test ran on real tick data? |
| 2 | Total Trades, Total Deals | Is the sample large enough to say anything? |
| 3 | Total Net Profit, Gross Profit, Gross Loss | What was left after costs, and from which two sums? |
| 4 | Balance and Equity Drawdown | How deep did the account fall on the way? |
| 5 | Profit Factor, Recovery Factor, Expected Payoff | How do profit, loss and drawdown relate? |
| 6 | Charts | When did trades happen, and how were they closed? |
The remaining lines are refinements of these six. A report that looks good in step 3 but fails step 1 or 2 has not shown much.
Read the settings and History Quality first
The top of the report repeats the test conditions. Check them before any result, because the same EA produces a different report with other inputs, another period or another broker’s price history.
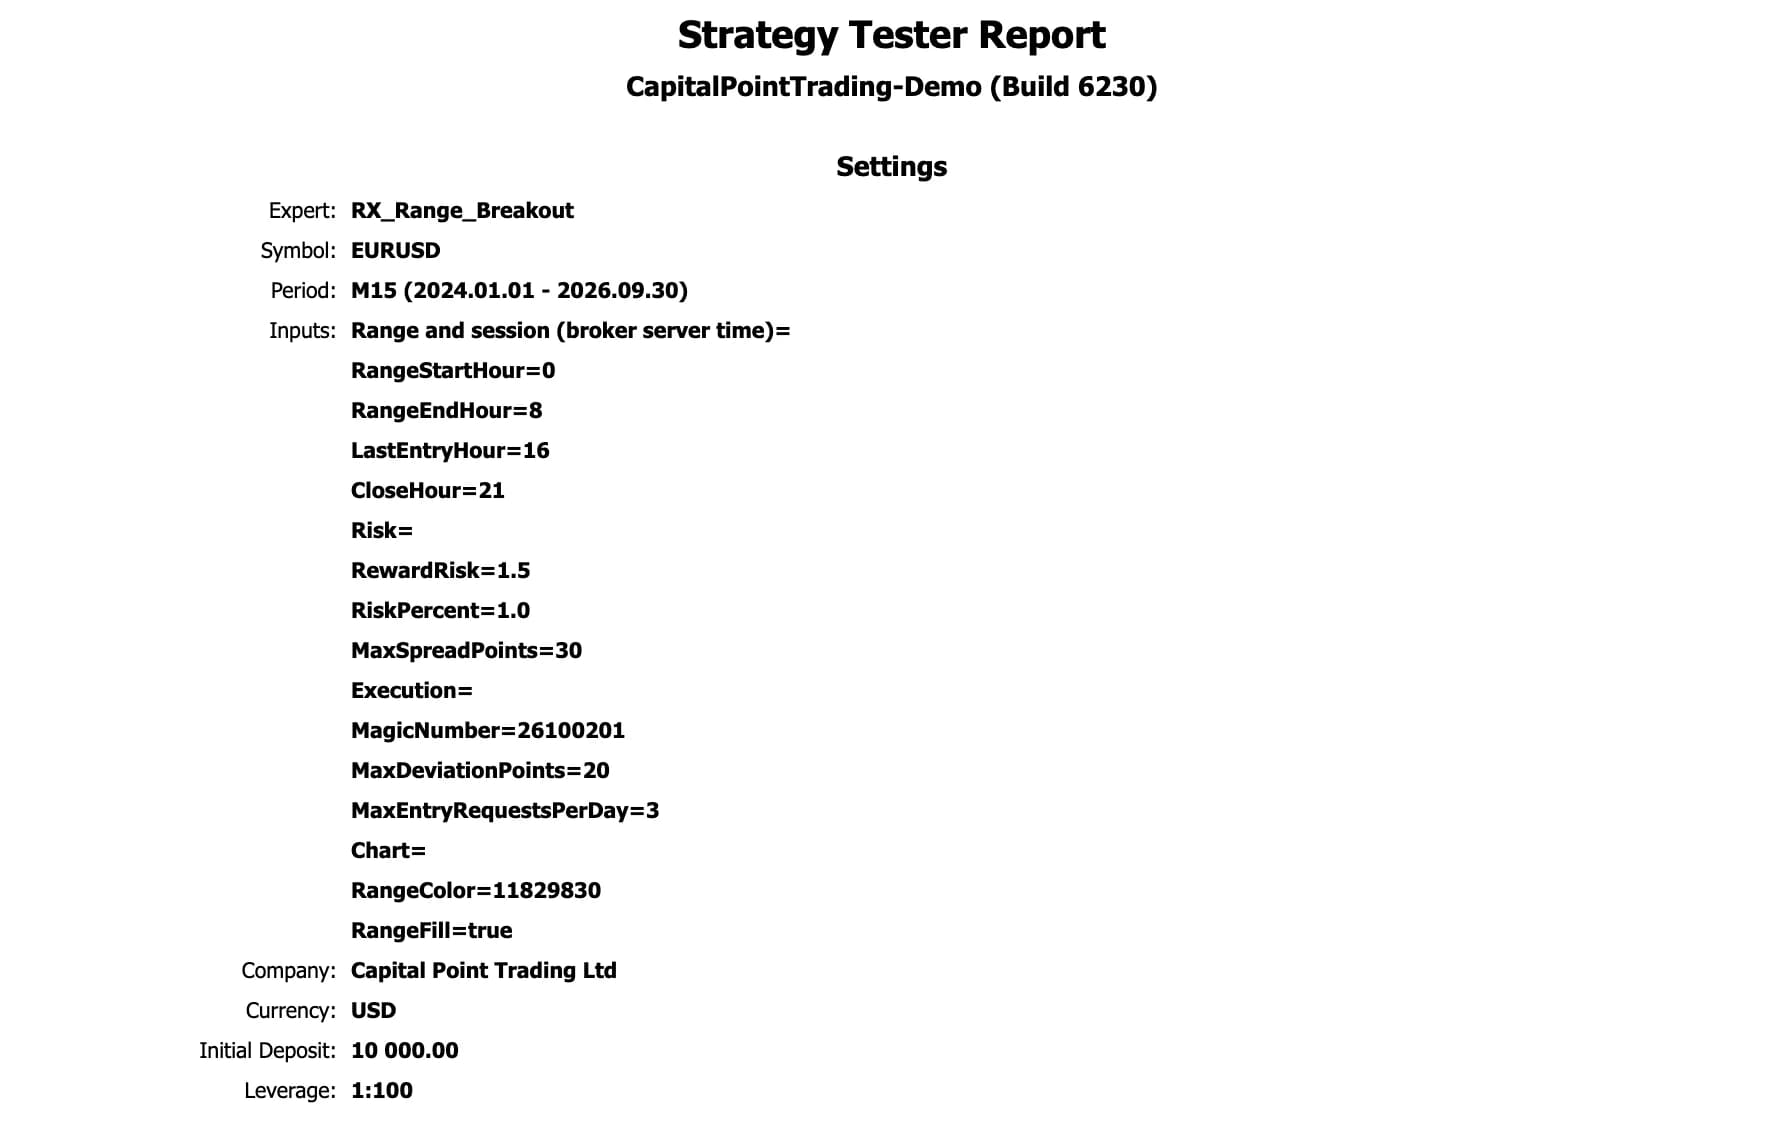
The table lists the lines to check in this block and why each one changes what the results mean:
Scroll horizontally if needed
| Line | In this report | Why it matters |
|---|---|---|
| Expert, Inputs | RX_Range_Breakout with all input values | A result belongs to one set of inputs. Another set is another test. |
| Symbol, Period | EURUSD, M15, 2024.01.01 to 2026.09.30 | The report covers 33 months and one symbol. |
| Company | Capital Point Trading Ltd | Price history, spread and commission come from this server. |
| Initial Deposit, Leverage | 10,000.00 USD, 1:100 | All percentages in the report refer to this starting amount. |
| History Quality | 18% real ticks | Only this share of the test used recorded ticks. |
History Quality deserves the first look. Our test mode was “Every tick based on real ticks”. The demo server supplied real ticks from 1 April 2026 only. For the 27 months before that, the tester generated ticks from minute bars, which MetaQuotes documents in its help on real and generated ticks as the fallback when tick data is missing. Our glossary explains real ticks and the five test modes.
The printed value and the help text do not use the same words. The MetaTrader 5 help defines History Quality as “a percentage ratio of correct and incorrect one-minute data”. Our report prints “18% real ticks”. Six of the 33 tested months had real ticks, which is 18%. Take the line as it is printed in your own report and check the tester journal for the date from which real ticks were available.
A strategy that depends on a few points of spread, such as a scalper, can look very different between generated and real ticks. Our example trades once a day with stops of a few hundred points, so the effect is smaller, but the limit still belongs next to every figure quoted from this report.
How a deal becomes a figure
The summary is built from the Deals table at the end of the report. A deal is one execution. A position that is opened and closed once produces two deals: an entry (“in”) and an exit (“out”).
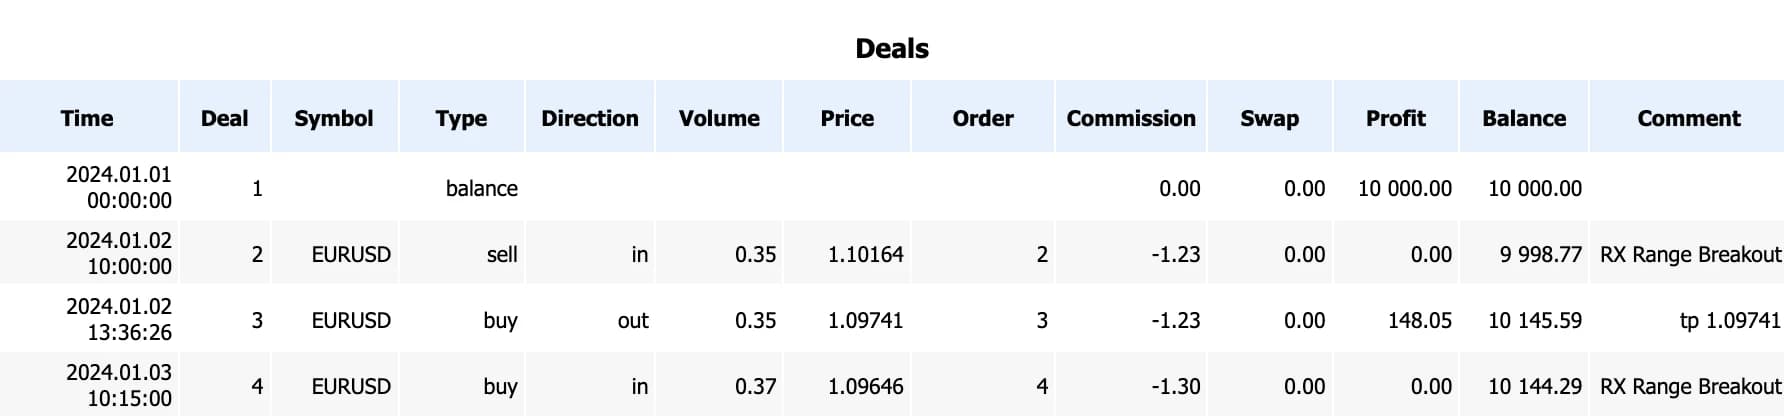
We read all 1,292 deals with a short Python script and rebuilt the summary. The table shows, by group, which figures we recomputed and how many of them equal the printed value:
Scroll horizontally if needed
| Group | Figures recomputed | Result |
|---|---|---|
| Profit | Total Net Profit, Gross Profit, Gross Loss, Profit Factor, Expected Payoff, Recovery Factor | 6 of 6 match |
| Trades | Total Trades, Total Deals, profit and loss trades, short and long trades, largest and average trade | 10 of 10 match |
| Streaks | Six lines on consecutive wins and losses | 6 of 6 match |
| Balance drawdown | Absolute, Maximal, Relative | 3 of 3 match |
| Statistics | AHPR, GHPR, Z-Score, LR Correlation, LR Standard Error | 5 of 5 match |
| Holding time | Minimal, maximal, average | 3 of 3 match |
On the first run 31 of the 33 matched. Two needed a second attempt, and both are noted in the script: the report shows the more profitable of two equally long win streaks, and the percentage beside the Z-Score is calculated from the rounded value.
Ten lines cannot be rebuilt from the deal list because they need the price path between entry and exit: the three equity drawdown figures, Margin Level, the three MFE and MAE correlations, History Quality, Bars and Ticks. We did not attempt the Sharpe Ratio.
The recomputation shows one rule that the help page does not spell out. In this report every deal is sorted on its own. The first position of the run makes it visible:
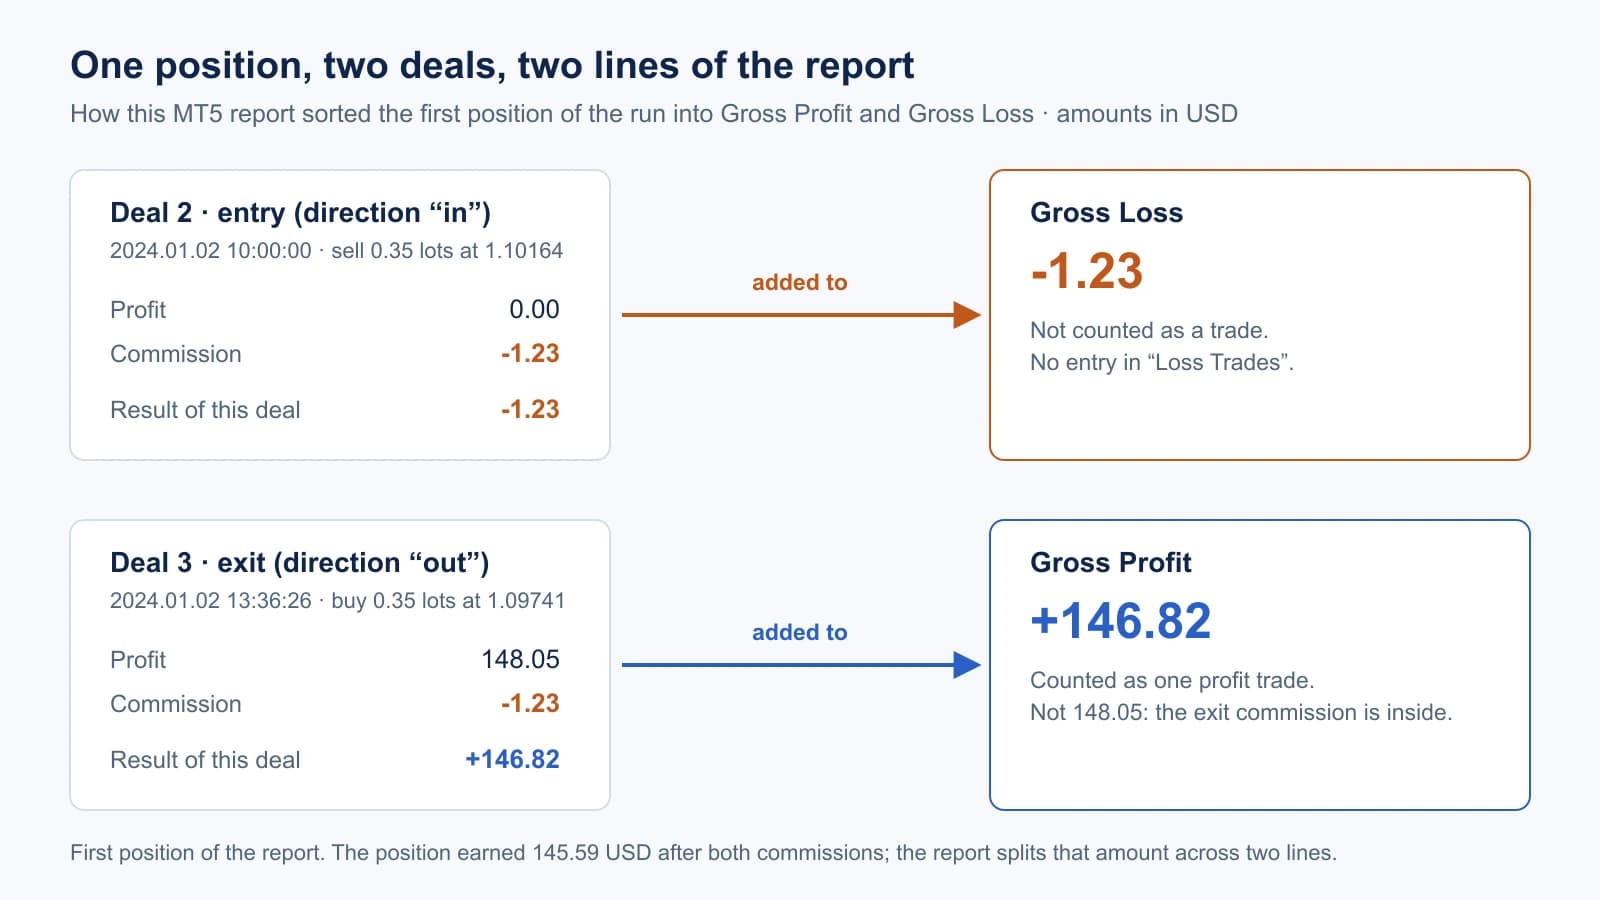
The entry deal has no profit, only its commission. That commission goes to Gross Loss. The exit deal carries the price result minus its own commission, and that amount goes to Gross Profit or Gross Loss. This rule explains every figure in the next section.
Profit factor, gross profit and gross loss
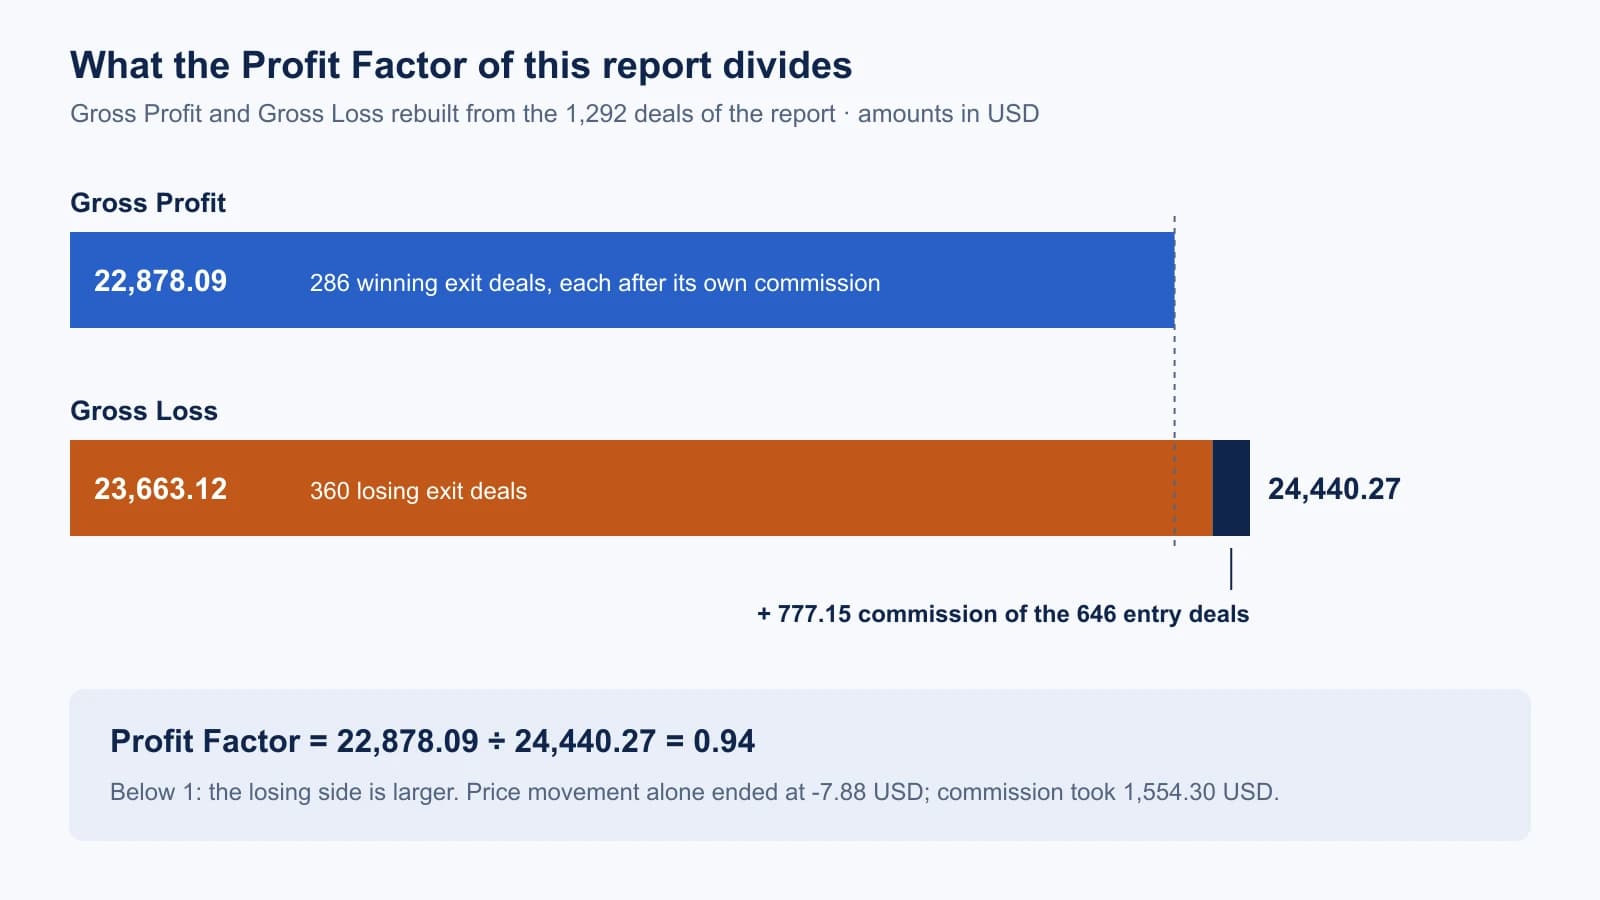
The profit factor is Gross Profit divided by Gross Loss. The MetaTrader 5 help defines it as the “ratio of the gross profit to the gross loss. A value of one means that these parameters are equal.” Here: 22,878.09 ÷ 24,440.27 = 0.94. Below 1, the losing side was larger.
Three things follow from the way the two sums are built.
“Gross” does not mean “before costs”. Both sums already contain commission. In this report the price movement of all 646 positions adds up to −7.88 USD, almost exactly zero. The commission of 1,554.30 USD produced the loss of 1,562.18 USD. You cannot see that split in the summary. It is only in the Commission column of the deal list.
Average loss times loss trades is not Gross Loss. The report shows an average loss trade of −65.73 and 360 loss trades. That gives 23,663.12, not 24,440.27. The difference of 777.15 is the commission of the entry deals, which sits in Gross Loss without being a trade.
The number of winners depends on where the commission is counted. The same 646 positions give three counts:
Scroll horizontally if needed
| Counting rule | Winners |
|---|---|
| Price result only, no commission | 288 |
| Exit deal with its own commission, as the report counts | 286 |
| Both commissions of the position | 285 |
The differences are small here because the commission per position is small against the average trade. With a strategy that takes a few points per trade, they grow.
There is no profit factor that makes a strategy good. The value depends on the number of trades, the test period and the costs set in the tester. A profit factor of 2 from 30 trades says less than 1.2 from 2,000. Our guide on how much spread a strategy can survive shows how quickly the value moves when costs change.
Balance drawdown and equity drawdown
The report prints three drawdown figures for the balance and the same three for equity. They measure different distances on the same line.
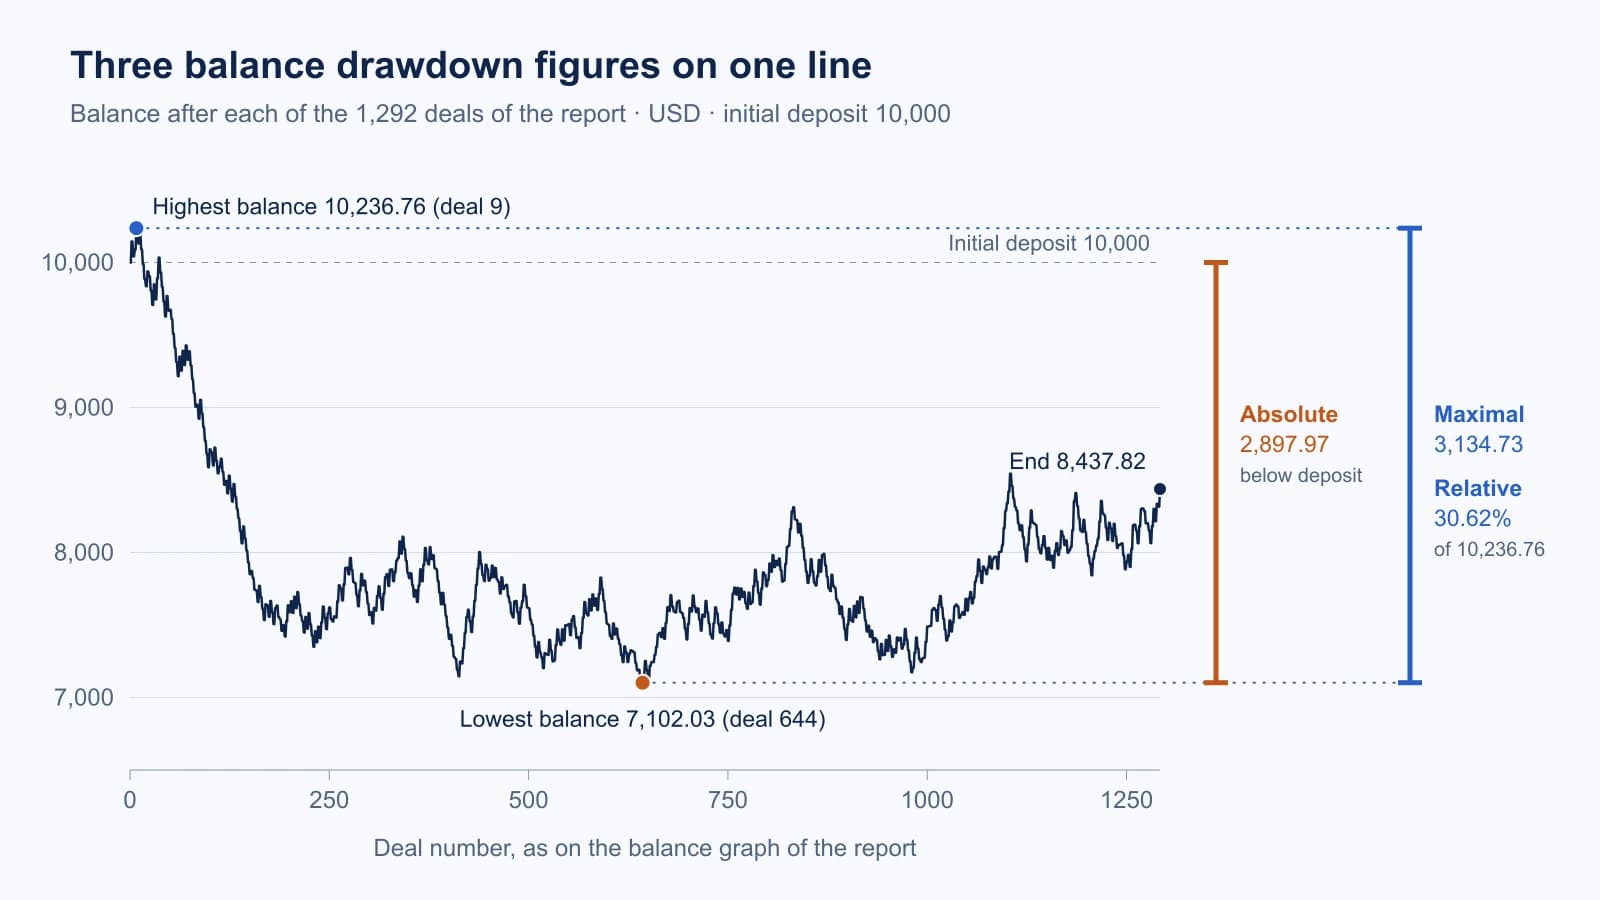
The table sets the formula from the MetaTrader 5 help beside the calculation with the numbers of this report:
Scroll horizontally if needed
| Line | MetaQuotes formula | In this report |
|---|---|---|
| Balance Drawdown Absolute | Initial deposit minus the lowest balance | 10,000 − 7,102.03 = 2,897.97 |
| Balance Drawdown Maximal | Largest fall in money from a high to the next low | 10,236.76 − 7,102.03 = 3,134.73 |
| Balance Drawdown Relative | Largest fall in percent of the high it started from | 3,134.73 ÷ 10,236.76 = 30.62% |
Maximal and Relative describe the same fall here. That is not always so. An account that grows first can have its largest fall in money late, at a high balance, and its largest fall in percent early, at a low balance. Then the two lines show different falls, and each prints the other unit in brackets.
Absolute drawdown is the weakest of the three. It only measures how far the balance went below the starting amount. A strategy that doubles the account and then loses half of it shows an absolute drawdown of zero.
Equity drawdown is the one that counts for risk. Balance changes only when a deal is executed. Equity also contains the open position. In this report equity drawdown is 3,202.08 (31.21%), slightly above the balance figure, because each position has a fixed stop and is closed the same day. For a grid or martingale EA that holds losing positions open, the two can be far apart. Our guide on equity drawdown vs balance drawdown shows that case.
Two details are easy to miss. The lowest balance of this run, 7,102.03, was reached at an entry deal: the commission of a new position pushed the balance to its low. And the balance graph in the report has no dates:
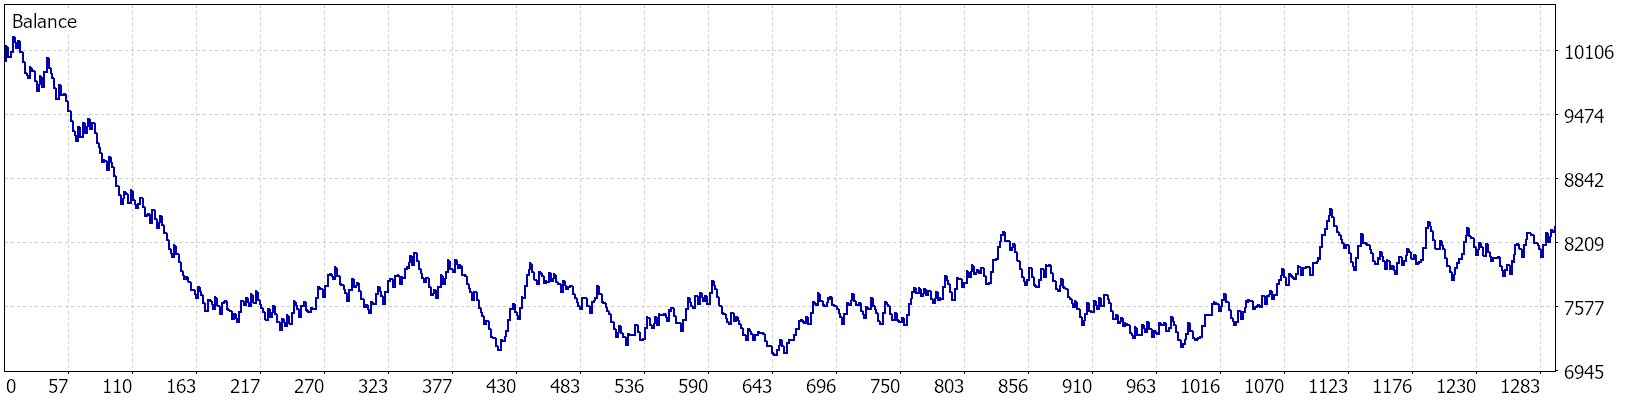
The horizontal axis counts deals. The steep fall at the start covers the first 80 positions, which took about four months. A strategy that trades in bursts looks smooth on this axis even when it stood still for months. Compare the graph with the dates in the deal list.
Recovery factor, expected payoff and the other ratios
Recovery Factor is net profit divided by maximal drawdown. The MetaTrader 5 help describes it as “the ratio of gained profit to the maximum drawdown” and does not say which drawdown. In this report it is the equity drawdown: −1,562.18 ÷ 3,202.08 = −0.49. With the balance drawdown the result would be −0.50. A negative value simply repeats that the test lost money.
Expected Payoff is net profit divided by the number of trades: −1,562.18 ÷ 646 = −2.42 USD per trade. It is an average over this test. It scales with the lot size, so it cannot be compared between tests with different deposits or risk settings.
The remaining ratio lines of the block, with the value in this report and what each one measures:
Scroll horizontally if needed
| Line | In this report | What it is |
|---|---|---|
| AHPR | 0.9998 (−0.02%) | Average balance change per trade, arithmetic mean |
| GHPR | 0.9997 (−0.03%) | The same as geometric mean: final balance ÷ deposit, 646th root |
| LR Correlation | −0.29 | How closely the balance follows a straight line; the sign follows the slope |
| LR Standard Error | 561.75 | Average distance of the balance from that line, in USD |
| Z-Score | 0.94 (65.28%) | Whether wins and losses come in more or fewer streaks than chance would give |
| Sharpe Ratio | −1.52 | Return against its variation; negative for a losing test |
| Margin Level | 852.05% | The lowest margin level reached during the test |
GHPR is the more honest of the first two because it follows from the start and end balance alone. An LR Correlation near 1 means a steadily rising balance. Ours is weak and negative: the balance fell, but not along a line.
The Z-Score answers one question: do losses follow losses more often than chance? The same help page sets the mark at 3: “A value above 3 indicates that a win will be followed by a loss with the probability of 3 sigma (99.67%).” At 0.94 this report shows no such pattern. That matters for anyone who wants to raise the lot size after a loss: the data here gives no reason for it.
For the Sharpe Ratio the help page gives its own reading: below 0 the strategy is unprofitable, between 0 and 1 “the risk does not pay off”, from 1 it “can mean that the risk pays off”. We did not recompute this value.
Margin Level shows how close the test came to a margin call. At 852% this run was far away. A value near your broker’s stop-out level means the backtest survived by a small distance.
Trade counts and streaks
Total Deals is twice Total Trades in this report: 1,292 deals, 646 trades. A trade is a closed position; each one has an entry deal and an exit deal. An EA that closes positions in parts or adds to them produces more deals per trade.
The win rate is 44.27%: 286 profit trades against 360 loss trades. With an average win of 79.99 and an average loss of 65.73, that is not enough. The break-even win rate for these two averages is about 45%, before the entry commission. A win rate means nothing without the size of the average win and loss beside it.
Short and long trades are listed with their own win rates: 305 short (45.25% won), 341 long (43.40% won). A large gap between the two would suggest that the result depends on one market direction during the test period. Here both sides lost.
The streak lines come in pairs that look alike and measure different things:
Scroll horizontally if needed
| Line | Reads as | In this report |
|---|---|---|
| Maximum consecutive wins ($) | The longest win streak, and its total | 8 trades (665.54) |
| Maximal consecutive profit (count) | The most profitable win streak, and its length | 665.54 (8 trades) |
| Maximum consecutive losses ($) | The longest loss streak, and its total | 8 trades (−491.32) |
| Maximal consecutive loss (count) | The most expensive loss streak, and its length | −491.32 (8 trades) |
In this report both pairs point to the same streak. They can differ: three large losses in a row can cost more than eight small ones. For position sizing the second pair matters more. The longest loss streak of a backtest is also not a limit. A longer test period usually contains a longer streak.
The charts below the numbers
The report ends with four images. They are worth a minute each, because they show things the summary averages away.
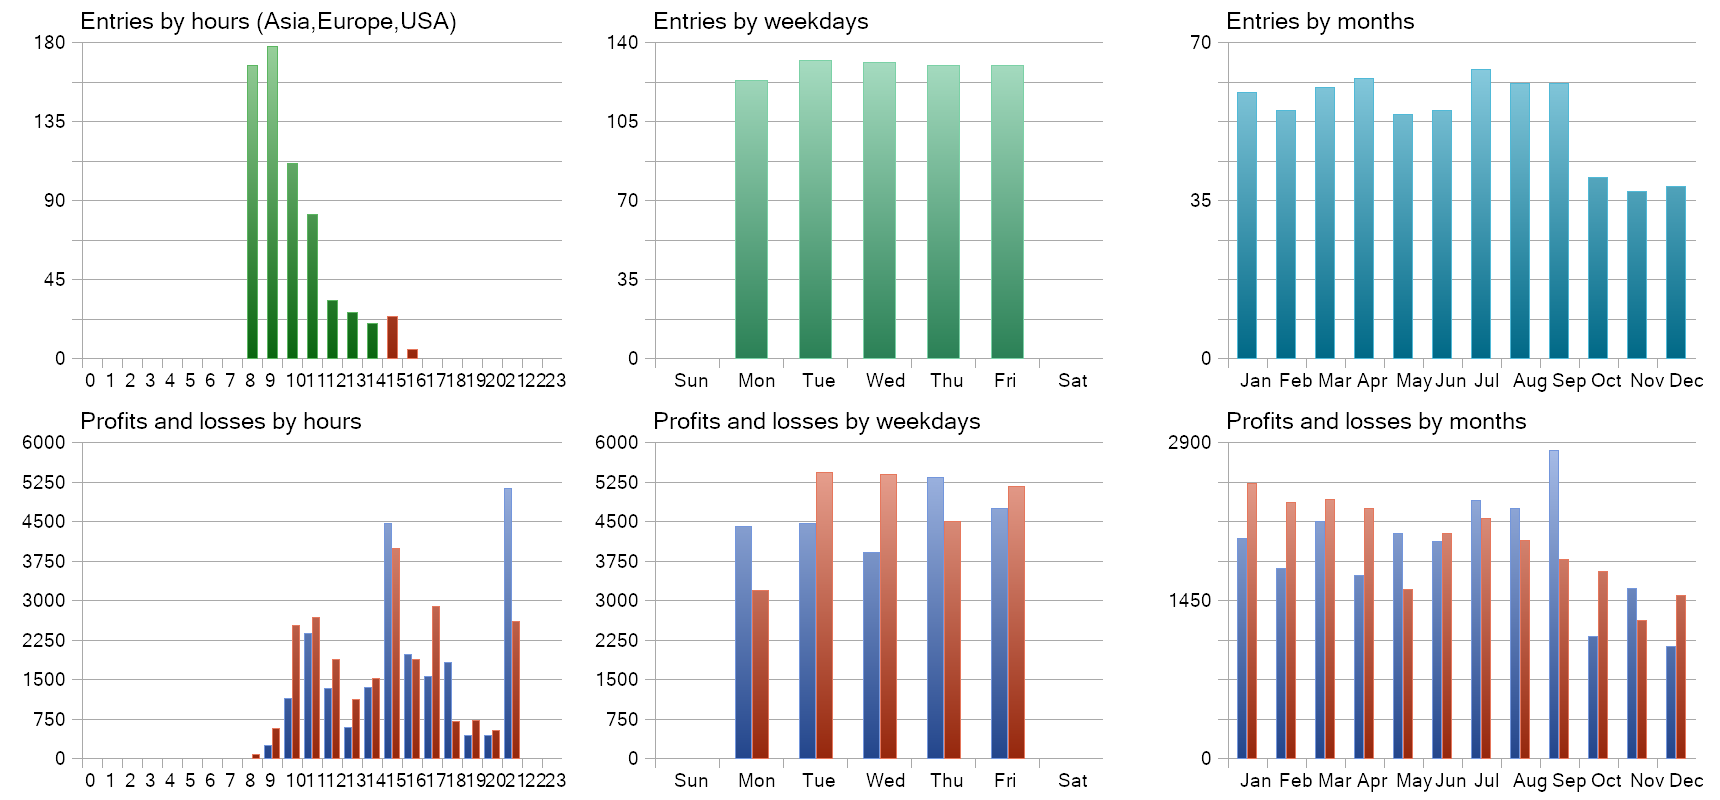
Entries by hours is a quick check of the rule. Our EA may only enter after a bar that opens between 08:00 and 16:00 server time. The chart shows entries from hour 8 to hour 16 and none outside. An entry at 03:00 would have meant a bug.
Entries by months shows fewer trades from October to December. That is the test period, not the strategy: the test covers January to September three times and October to December twice. Any chart by month or weekday needs this check before it is read as a seasonal pattern.
Profits and losses by hours counts exit deals. The tall bars at hour 21 are the time exit: 230 of the 646 positions were closed at 21:00 because neither stop nor target was hit.
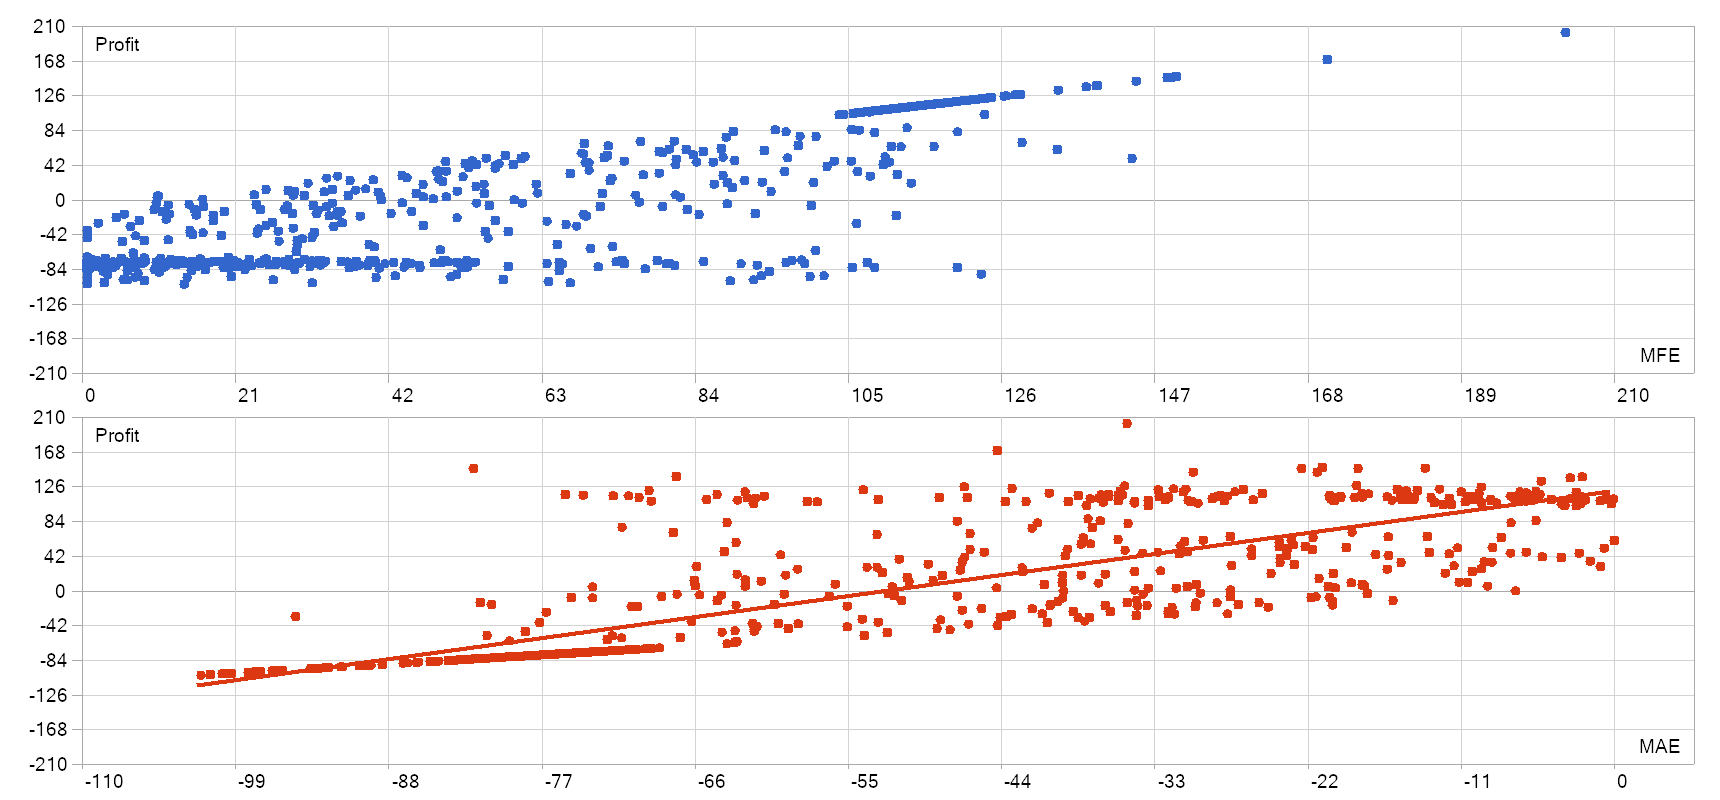
MFE (Maximum Favorable Excursion) is the largest open profit a position had before it closed. MAE (Maximum Adverse Excursion) is its largest open loss. Each point is one position.
In the upper chart the horizontal band near −84 are positions that ended at the stop. Many of them had been 40 or 60 USD in profit first. The short diagonal line on the right are positions that reached the target: their result equals their best moment. In the lower chart the points on the line at the left are the stop-outs, where the final loss equals the worst moment. The cloud above the line are positions that came back from a loss.
The three correlation lines in the summary (0.84, 0.80 and 0.61 here) compress these pictures into one number each. The pictures say more. A strategy without a stop shows a lower chart with points far to the left that closed in profit: positions that were held through a deep loss.
What the report cannot tell you
- It describes one set of inputs on one price history. Another broker has other spreads, other commission and another server time. The same EA produces another report there.
- It contains the costs that were set in the tester, and no others. This run used the server’s commission and spread and no execution delay. Slippage on a live account is not in it.
- It does not show how the inputs were found. A report from the best of 5,000 optimisation passes looks the same as a report from inputs fixed in advance. Ours were fixed before the first test and not changed.
- It does not separate periods. One good year can carry two bad ones. In this run 2024 lost 2,490 USD, 2025 was flat and the first nine months of 2026 gained 982 USD. The summary shows only the sum.
- It is not a forecast. A backtest shows that rules were followed on past data. Our guide on backtest vs live trading explains the steps between a report and a funded account.
Check your own backtest report
- Save the report as a file, so that the deal list is included. We set
Report=in the tester start configuration; MetaTrader then writes an HTML file with four images. - Read History Quality and compare the tested period with the date from which your broker supplies real ticks.
- Count the trades. Below a few hundred, treat every ratio as a rough indication.
- Read Total Net Profit together with the Commission and Swap columns of the deal list. Add both columns up.
- Read Equity Drawdown Maximal and Relative. Ask whether you would have kept the EA running through that fall.
- Compare the balance graph with the dates in the deal list.
- Split the result by year. The deal list has the dates and the balance.
- Check the entry charts against the rule the EA is supposed to follow.
The download contains our report and the script. Run it on your own HTML report to see whether your build sorts deals the same way. The script expects one entry and one exit per position and stops with a message if a position was closed in parts.
Download report and script (ZIP). The original MT5 report as HTML with its four chart images, the Python script, its output and checksums. No executable, no account data.
Frequently asked questions
What is a good profit factor in the MT5 Strategy Tester?
There is no fixed mark. Above 1, gross profit was larger than gross loss in that test. How much weight the value carries depends on the number of trades, the share of real ticks and the costs set in the tester. MetaQuotes gives no threshold for the profit factor.
Does the MT5 report include commission and swap?
Yes, if the tested symbol has them. In our report every figure in the summary contains commission, including Gross Profit and Gross Loss. The amounts are listed per deal in the Commission and Swap columns.
Why is Total Deals higher than Total Trades?
A trade is a closed position. Each position has at least two deals, one entry and one exit. In our report 646 trades made 1,292 deals.
Why are equity drawdown and balance drawdown different?
Balance changes when a deal is executed. Equity also contains open positions, so it shows losses that are not yet closed. The larger the gap between the two, the more the strategy holds losing positions open.
Which drawdown does the Recovery Factor use?
In our report the Recovery Factor of −0.49 results from net profit divided by Equity Drawdown Maximal. The help page only says “maximum drawdown”. Recompute it in your own report if the value matters to you.

Sources & further reading
Your next question